. 2015 Dec 11;290(50):29834-53.
doi: 10.1074/jbc.M115.682245. Epub 2015 Oct 26.

Structural Dissection of the Maltodextrin Disproportionation Cycle of the Arabidopsis Plastidial Disproportionating Enzyme 1 (DPE1)

Affiliations

Structural Dissection of the Maltodextrin Disproportionation Cycle of the Arabidopsis Plastidial Disproportionating Enzyme 1 (DPE1)

Ellis C O'Neill et al. J Biol Chem. .

Abstract

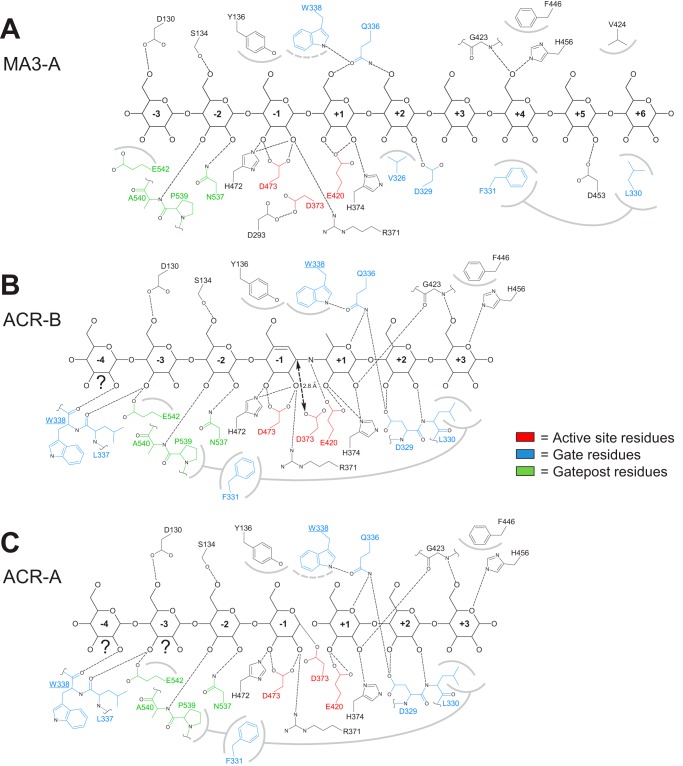
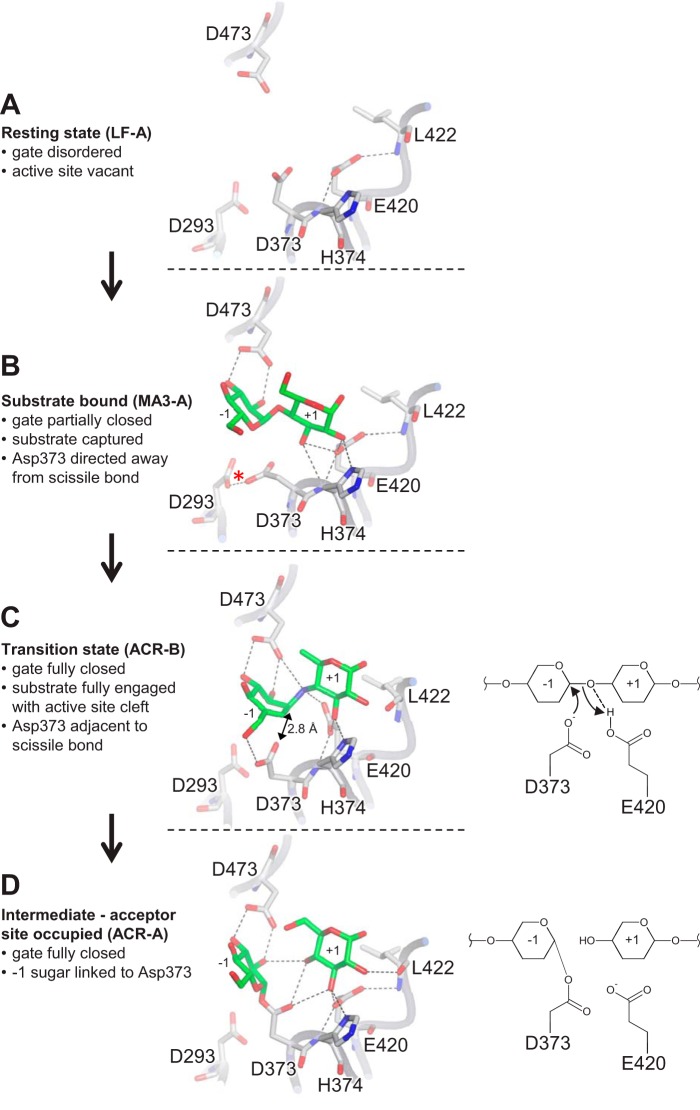
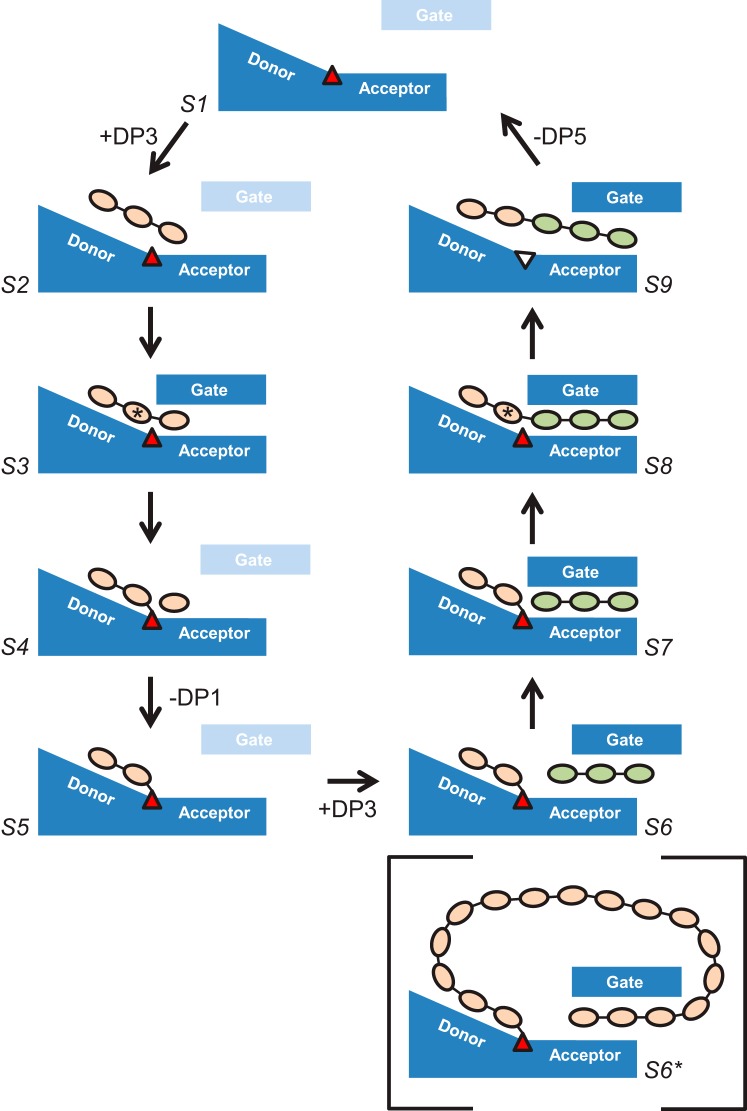
The degradation of transitory starch in the chloroplast to provide fuel for the plant during the night requires a suite of enzymes that generate a series of short chain linear glucans. However, glucans of less than four glucose units are no longer substrates for these enzymes, whereas export from the plastid is only possible in the form of either maltose or glucose. In order to make use of maltotriose, which would otherwise accumulate, disproportionating enzyme 1 (DPE1; a 4-α-glucanotransferase) converts two molecules of maltotriose to a molecule of maltopentaose, which can now be acted on by the degradative enzymes, and one molecule of glucose that can be exported. We have determined the structure of the Arabidopsis plastidial DPE1 (AtDPE1), and, through ligand soaking experiments, we have trapped the enzyme in a variety of conformational states. AtDPE1 forms a homodimer with a deep, long, and open-ended active site canyon contained within each subunit. The canyon is divided into donor and acceptor sites with the catalytic residues at their junction; a number of loops around the active site adopt different conformations dependent on the occupancy of these sites. The "gate" is the most dynamic loop and appears to play a role in substrate capture, in particular in the binding of the acceptor molecule. Subtle changes in the configuration of the active site residues may prevent undesirable reactions or abortive hydrolysis of the covalently bound enzyme-substrate intermediate. Together, these observations allow us to delineate the complete AtDPE1 disproportionation cycle in structural terms.

Keywords: Arabidopsis; acarbose; acarviostatin; carbohydrate metabolism; chloroplast; crystal structure; cycloamylose; disproportionating enzyme 1; glycosyltransferase; starch degradation.


Figures

FIGURE 1.
FIGURE 1.
Characterization of acarviostatin II01 by 1H NMR. A, structure of acarviostatin II01; B, its one-dimensional 1H NMR spectrum (400 MHz, D2O, 25 °C). Partial signal assignment was made using two-dimensional COSY, HSQC, and ROESY NMR experiments and based on a previous detailed assignment of acarviosin-containing oligosaccharides (59).
FIGURE 2.
FIGURE 2.
Positive ion mode ESI-MS/MS fragmentation of acarviostatin II01 [M + H]+ at m/z 1111.43.
FIGURE 3.
FIGURE 3.
Structural summary of AtDPE1. A, the elongated AtDPE1 homodimer is shown in a schematic representation. The N-terminal arms of both subunits are colored in dark blue; otherwise, the left-hand subunit is colored by domain as indicated (see also Fig. 4), and the right-hand subunit is in gray. The structure shown is that derived from a crystal soaked in maltotriose (MA3) with maltononaose bound to the left-hand subunit and maltooctaose bound to the right-hand subunit, depicted as red van der Waals spheres. B, same view as in A but with the protein represented as a molecular surface. This clearly shows how the N-terminal arm of the right-hand subunit embraces its partner and contributes significantly to the dimer interface. C, close-up taken from A focusing on the region containing the active site canyon, which is defined by loops from the B1, B2, and B3 subdomains. The elements of the antiparallel β-sheet made up of four strands from subdomain B1 and one from the N-terminal arm of the opposing subunit are labeled; β5 and β6 delineate the gate motif, whereas β8 and β9 delineate the brace motif. N terminus, the first crystallographically resolved residue (Ser-60). D, AtDPE1 MA3 structure viewed from above relative to the perspective shown in A but with the left-hand subunit in slate blue. E, the homotetrameric amylomaltase from A. aeolicus (PDB code 1TZ7) arranged and colored to highlight the observation that it resembles a pair of intertwined AtDPE1 dimers (note the similarity with the dimer in D); such an assembly is not possible in AtDPE1 due to steric clashes with the N-terminal arms.
FIGURE 4.
FIGURE 4.
Structure-based multiple-sequence alignment of AtDPE1 with its closest structural homologues. Shown are the sequences of DPE1 enzymes from A. thaliana (A.thal; MA3-A structure) and S. tuberosum (S.tube; PDB code 1X1N) and amylomaltases from T. brokianus (T.brok; PDB code 2X1I), T. aquaticus (T.aqua; PDB code 1ESW), and A. aeolicus (A.aeol; PDB code 1TZ7). The sequence for the T. thermophilus enzyme was not included because this differs from that of T. aquaticus by only a single amino acid (at position 104 in AtDPE1 numbering). The initial alignment was generated using the PDBeFold server (60). This was subsequently adjusted manually with reference to the superposed structures and then displayed using ESPript3.0 (61). Strictly conserved residues are highlighted with red shaded boxes, and semiconserved residues are colored red. Secondary structure elements for AtDPE1 are shown above the alignment, where α = α helix, β = β strand, η = 310 helix, TT = β turn. Also labeled are the secondary structural elements of the central (βα)8 barrel (i.e. domain A) as “β1,” “α1,” etc., and the positions of the gate, brace, and gatepost motifs. The colored bars below the alignment denote the structural domains as indicated in the key and displayed in Fig. 3. The white dots show the positions of the three catalytic residues, and the black dots indicate other important residues that are referred to throughout.
FIGURE 5.
FIGURE 5.
Plots highlighting conformational changes between selected AtDPE1 structures. A, Cα-Cα displacements relative to the MA3-A structure are plotted for the whole sequence; B, the plot is expanded to focus on just the region encompassing the whole of the B1 subdomain. Gaps indicate disordered regions.
FIGURE 6.
FIGURE 6.
Schematic representations of the ligand-bound complexes of AtDPE1. For each different binding mode, the occupancy of the various subsites is indicated. The triangles indicate the status of the active site nucleophiles. For MA3-A, density was present for a residue in the +6 site, but not for MA3-B; otherwise, the bound ligands were very similar. For ACR-A and ACR-B, the identities of several of the sugar residues were uncertain (indicated by the question marks below these residues), and a non-glucose sugar was only inserted when there was compelling evidence for it. Also shown for comparison are the relevant ligand-bound complexes of the amylomaltases.
FIGURE 7.
FIGURE 7.
Stereoviews showing omit electron density maps for ligands bound to AtDPE1. Omit electron density maps were calculated after removal of the bound ligands and the catalytic nucleophile (Asp-373) and re-refining. These are displayed contoured at ∼3σ superimposed on the refined coordinates of the atoms that were omitted. The resolutions of each of these are indicated. Where the ligand occupying the donor site is covalently linked to the nucleophile, this has been highlighted with a red arrow.
FIGURE 8.
FIGURE 8.
Conformational changes coupled to active site occupancy in AtDPE1. Overview of conformation changes between MA3-A (A and B) and ACR-B (C and D) structures, where the protein backbone is either shown in a schematic representation (A and C) or displayed as a molecular surface (B and D); selected key residues and the bound ligands are shown in stick representations. E, overlay of MA3-A, ACR-B, and BCD-A AtDPE1 structures with T. thermophilus AMY (PDB code 2OWW) to illustrate conformational differences between the gate (G), brace (B), gatepost (P), and N-terminal arm (N), which are highlighted by the double-headed dashed arrows. In ACR-A and ACV-A/B, these motifs display conformations similar to that of ACR-B (not shown), although the brace was not fully ordered in ACR-A (see Fig. 5). Note that the gate in BCD-A displays the most open conformation but is disordered at the tip, such that Phe-331 is not resolved in the electron density.
FIGURE 9.
FIGURE 9.
Schematic figures detailing protein-ligand interactions for selected AtDPE1 complexes. Shown are protein-ligand interactions for MA3-A (A), ACR-B (B), and ACR-A (C), where dashed lines indicate hydrogen bonds and gray arcs indicate van der Waals interactions with the adjacent sugar(s). The connecting gray lines indicate interactions between protein side chains. For simplicity, hydrogens have been omitted as well as any water-mediated interactions. In B and C, Trp-338 makes both hydrogen bonding and hydrophobic interactions with sugars that are widely spaced in this two-dimensional representation, and for this reason, the residue appears twice. For ACR-A and ACR-B, the identities of several of the sugar residues were uncertain (indicated by the question marks below these residues).
FIGURE 10.
FIGURE 10.
Detail of important interactions at the active site of AtDPE1 relevant to catalysis. Selected key amino acids are shown in stick representation at the junction of donor and acceptor binding sites. Hydrogen bonds are indicated by dashed lines, with the putative low barrier hydrogen bond (referred to under “Discussion”) marked by a red asterisk in B. For each part, the coordinates are taken from the structures given in brackets, and for the ligand-bound structures only the −1 and +1 sugars are shown for simplicity. For C and D, a schematic representation is also shown to the right to illustrate the progression from the transition state to the intermediate (for clarity, the sugars are shown as simple six-membered rings). The incompetent conformation of the nucleophile (Asp-373) in B may be more representative of a post-catalytic product-bound state (where a further catalytic event would be counterproductive) and may be dictated by the occupancy of the acceptor site (note that subsites +2 to +6 are also occupied in MA3-A but are not shown here). However, in a precatalytic substrate-bound state with maltotriose spanning subsites −2 to +1, where catalysis is desirable, there would be no necessity for Asp-373 to adopt the incompetent conformation. In the absence of such a structure, this remains just speculation.
FIGURE 11.
FIGURE 11.
A putative scheme for AtDPE1-catalyzed transglycosylation. Shown is a schematic representation of the various states (S1–S9) proposed for the disproportionation of two molecules of maltotriose by AtDPE1 to yield glucose and maltopentaose. The gate is shown either as disordered (pale blue) or in a partially or a fully closed conformation and may play a more significant role in the second half-reaction. Also shown (S6*) is a putative intermediate state, where the gate is involved in capturing the non-reducing end of a long donor molecule in the acceptor site to yield a cyclic product. All sugars are expected to adopt a 4C1 chair conformation except at the −1 subsites in the two transition states where a half-chair conformation is expected (indicated by the asterisks). The red triangle indicates the active site nucleophile (Asp-373), which is shown in an incompetent conformation (and colored white) in the post-catalytic state S9, in accordance with the MA3-A structure upon which this is based (see Figs. 9A and 10B). By contrast, we speculate that in the precatalytic substrate-bound state S2, the nucleophile adopts a catalytically competent conformation.

References

    1. Zeeman S. C., Kossmann J., and Smith A. M. (2010) Starch: its metabolism, evolution, and biotechnological modification in plants. Annu. Rev. Plant Biol. 61, 209–234 - PubMed
    1. Smith A. M. (2012) Starch in the Arabidopsis plant. Starch 64, 421–434
    1. Smirnova J., Fernie A. R., and Steup M. (2015) in Starch: Metabolism and Structure (Nakamura Y., ed) pp. 239–290, Springer Publishing, Tokyo
    1. Smith A. M., Zeeman S. C., and Smith S. M. (2005) Starch degradation. Annu. Rev. Plant Biol. 56, 73–98 - PubMed
    1. Delatte T., Umhang M., Trevisan M., Eicke S., Thorneycroft D., Smith S. M., and Zeeman S. C. (2006) Evidence for distinct mechanisms of starch granule breakdown in plants. J. Biol. Chem. 281, 12050–12059 - PubMed

Publication types

LinkOut - more resources