

Do clinicians understand the size of treatment effects? A randomized survey across 8 countries
- PMID: 26504102
- PMCID: PMC4695351
- DOI: 10.1503/cmaj.150430
Do clinicians understand the size of treatment effects? A randomized survey across 8 countries
Abstract
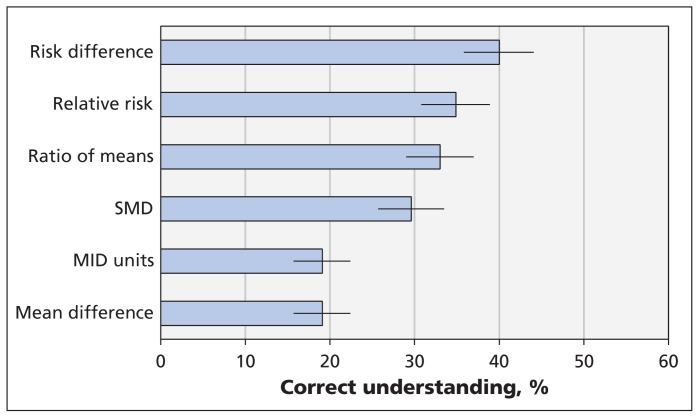
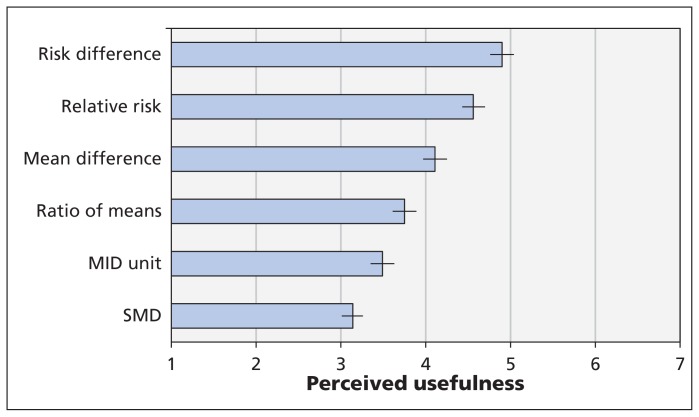
Background: Meta-analyses of continuous outcomes typically provide enough information for decision-makers to evaluate the extent to which chance can explain apparent differences between interventions. The interpretation of the magnitude of these differences - from trivial to large - can, however, be challenging. We investigated clinicians' understanding and perceptions of usefulness of 6 statistical formats for presenting continuous outcomes from meta-analyses (standardized mean difference, minimal important difference units, mean difference in natural units, ratio of means, relative risk and risk difference).
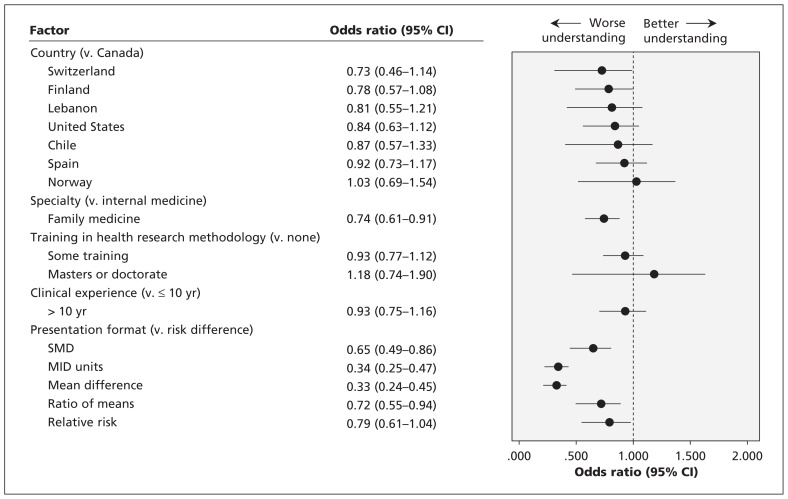
Methods: We invited 610 staff and trainees in internal medicine and family medicine programs in 8 countries to participate. Paper-based, self-administered questionnaires presented summary estimates of hypothetical interventions versus placebo for chronic pain. The estimates showed either a small or a large effect for each of the 6 statistical formats for presenting continuous outcomes. Questions addressed participants' understanding of the magnitude of treatment effects and their perception of the usefulness of the presentation format. We randomly assigned participants 1 of 4 versions of the questionnaire, each with a different effect size (large or small) and presentation order for the 6 formats (1 to 6, or 6 to 1).
Results: Overall, 531 (87.0%) of the clinicians responded. Respondents best understood risk difference, followed by relative risk and ratio of means. Similarly, they perceived the dichotomous presentation of continuous outcomes (relative risk and risk difference) to be most useful. Presenting results as a standardized mean difference, the longest standing and most widely used approach, was poorly understood and perceived as least useful.
Interpretation: None of the presentation formats were well understood or perceived as extremely useful. Clinicians best understood the dichotomous presentations of continuous outcomes and perceived them to be the most useful. Further initiatives to help clinicians better grasp the magnitude of the treatment effect are needed.
© 2016 Canadian Medical Association or its licensors.
Figures
Comment in
-
Physicians and knowledge translation of statistics: Mind the gap.CMAJ. 2016 Jan 5;188(1):11-12. doi: 10.1503/cmaj.151254. Epub 2015 Nov 30. CMAJ. 2016. PMID: 26621998 Free PMC article. No abstract available.
-
Minimal important difference is important.CMAJ. 2016 Apr 5;188(6):451. doi: 10.1503/cmaj.1150088. CMAJ. 2016. PMID: 27044791 Free PMC article. No abstract available.
Similar articles
-
Understanding effect size: an international online survey among psychiatrists, psychologists, physicians from other medical specialities, dentists and other health professionals.BMJ Ment Health. 2024 Feb 21;27(1):e300978. doi: 10.1136/bmjment-2023-300978. BMJ Ment Health. 2024. PMID: 38388002 Free PMC article.
-
The future of Cochrane Neonatal.Early Hum Dev. 2020 Nov;150:105191. doi: 10.1016/j.earlhumdev.2020.105191. Epub 2020 Sep 12. Early Hum Dev. 2020. PMID: 33036834
-
[GRADE guidelines: 13. Preparing Summary of Findings tables and evidence profiles - continuous outcomes].Z Evid Fortbild Qual Gesundhwes. 2014;108(5-6):333-47. doi: 10.1016/j.zefq.2014.05.002. Epub 2014 Jul 2. Z Evid Fortbild Qual Gesundhwes. 2014. PMID: 25066353 German.
-
Systematic reviews of the effectiveness of day care for people with severe mental disorders: (1) acute day hospital versus admission; (2) vocational rehabilitation; (3) day hospital versus outpatient care.Health Technol Assess. 2001;5(21):1-75. doi: 10.3310/hta5210. Health Technol Assess. 2001. PMID: 11532238 Review.
-
Cochrane Review: Osmotic and stimulant laxatives for the management of childhood constipation (Review).Evid Based Child Health. 2013 Jan;8(1):57-109. doi: 10.1002/ebch.1893. Evid Based Child Health. 2013. PMID: 23878124 Review.
Cited by
-
Minimal important difference is important.CMAJ. 2016 Apr 5;188(6):451. doi: 10.1503/cmaj.1150088. CMAJ. 2016. PMID: 27044791 Free PMC article. No abstract available.
-
Efficacy and safety of low and very low carbohydrate diets for type 2 diabetes remission: systematic review and meta-analysis of published and unpublished randomized trial data.BMJ. 2021 Jan 13;372:m4743. doi: 10.1136/bmj.m4743. BMJ. 2021. PMID: 33441384 Free PMC article.
-
Foundational Statistical Principles in Medical Research: A Tutorial on Odds Ratios, Relative Risk, Absolute Risk, and Number Needed to Treat.Int J Environ Res Public Health. 2021 May 25;18(11):5669. doi: 10.3390/ijerph18115669. Int J Environ Res Public Health. 2021. PMID: 34070675 Free PMC article. Review.
-
Visual data: a new tool to improve the presentation of clinical trial results.Einstein (Sao Paulo). 2019 Nov 25;18:eAE4729. doi: 10.31744/einstein_journal/2020AE4729. eCollection 2020. Einstein (Sao Paulo). 2019. PMID: 31778465 Free PMC article.
-
Comprendre et expliquer le risque: Mesurer les résultats et l’ampleur des bienfaits et des préjudices.Can Fam Physician. 2018 Mar;64(3):186-191. Can Fam Physician. 2018. PMID: 29540383 Free PMC article. French. No abstract available.
References
-
- Guyatt GH, Osoba D, Wu AW, et al. Methods to explain the clinical significance of health status measures. Mayo Clin Proc 2002;77:371–83. - PubMed
-
- Fransen M, McConnell S. Exercise for osteoarthritis of the knee. Cochrane Database Syst Rev 2008;(4):CD004376. - PubMed
-
- Higgins JPT, Green S, editors. Cochrane handbook for systematic reviews of interventions. Version 5.1.0 [updated March 2011]. London (UK): Cochrane Collaboration; 2011. Available: www.cochrane-handbook.org (accessed 2015 May 29).
-
- Van Den Noortgate W, Onghena P. Estimating the mean effect size in meta-analysis: bias, precision, and mean squared error of different weighting methods. Behav Res Methods Instrum Comput 2003;35:504–11. - PubMed
Publication types
MeSH terms
LinkOut - more resources
Full Text Sources
Other Literature Sources