

Growth Charts for Children With Down Syndrome in the United States
- PMID: 26504127
- PMCID: PMC5451269
- DOI: 10.1542/peds.2015-1652
Growth Charts for Children With Down Syndrome in the United States
Erratum in
-
Correction for ZEMEL 2015-1652.Pediatrics. 2022 Nov 1;150(5):e2022059568. doi: 10.1542/peds.2022-059568. Pediatrics. 2022. PMID: 36305216 Free PMC article. No abstract available.
Abstract
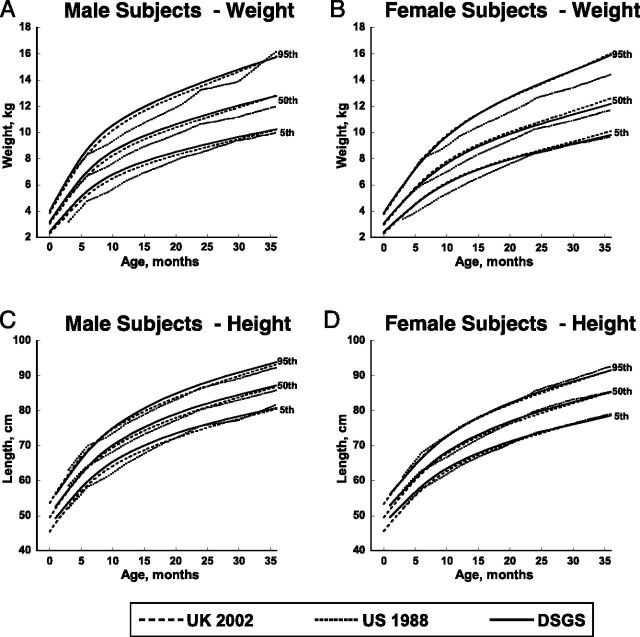
Background and objectives: Children with Down syndrome (DS) have lower birth weights and grow more slowly than children without DS. Advances in and increased access to medical care have improved the health and well-being of individuals with DS; however, it is unknown whether their growth has also improved. Our objective was to develop new growth charts for children with DS and compare them to older charts from the United States and more contemporary charts from the United Kingdom.
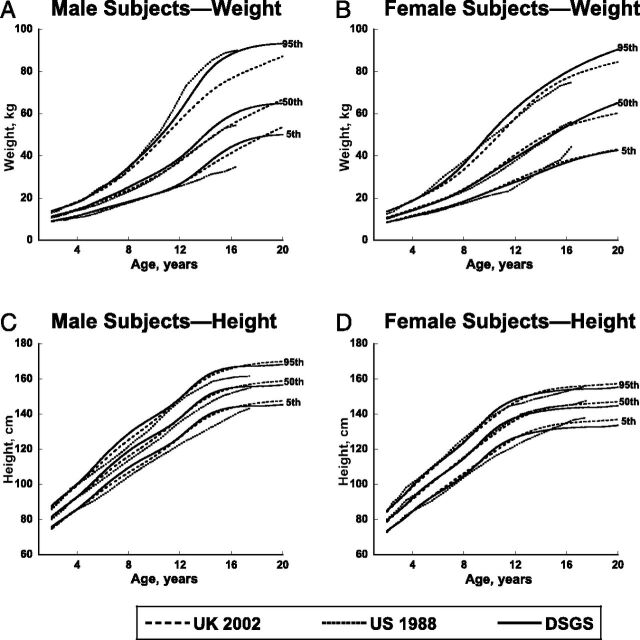
Methods: The Down Syndrome Growing Up Study (DSGS) enrolled a convenience sample of children with DS up to 20 years of age and followed them longitudinally. Growth parameters were measured by research anthropometrists. Sex-specific growth charts were generated for the age ranges birth to 36 months and 2 to 20 years using the LMS method. Weight-for-length and BMI charts were also generated. Comparisons with other curves were presented graphically.
Results: New DSGS growth charts were developed by using 1520 measurements on 637 participants. DSGS growth charts for children <36 months of age showed marked improvements in weight compared with older US charts. DSGS charts for 2- to 20-year-olds showed that contemporary males are taller than previous charts showed. Generally, the DSGS growth charts are similar to the UK charts.
Conclusions: The DSGS growth charts can be used as screening tools to assess growth and nutritional status and to provide indications of how growth of an individual child compares with peers of the same age and sex with DS.
Copyright © 2015 by the American Academy of Pediatrics.
Conflict of interest statement
Figures
References
-
- Parker SE , Mai CT , Canfield MA , et al. National Birth Defects Prevention Network . Updated National Birth Prevalence estimates for selected birth defects in the United States, 2004–2006. Birth Defects Res A Clin Mol Teratol. 2010;88(12):1008–1016 - PubMed
-
- Cronk C , Crocker AC , Pueschel SM , et al. Growth charts for children with Down syndrome: 1 month to 18 years of age. Pediatrics. 1988;81(1):102–110 - PubMed
-
- Bull MJ , Committee on Genetics . Health supervision for children with Down syndrome. Pediatrics. 2011;128(2):393–406 - PubMed
-
- Rasmussen SA , Whitehead N , Collier SA , Frías JL . Setting a public health research agenda for Down syndrome: summary of a meeting sponsored by the Centers for Disease Control and Prevention and the National Down Syndrome Society. Am J Med Genet A. 2008;146A(23):2998–3010 - PubMed
-
- Thase ME . Longevity and mortality in Down’s syndrome. J Ment Defic Res. 1982;26(pt 3):177–192 - PubMed
Publication types
MeSH terms
Grants and funding
LinkOut - more resources
Full Text Sources
Other Literature Sources
Medical
