. 2015 Oct 26;211(2):339-58.
doi: 10.1083/jcb.201506002.

ARF6-JIP3/4 regulate endosomal tubules for MT1-MMP exocytosis in cancer invasion

Affiliations

ARF6-JIP3/4 regulate endosomal tubules for MT1-MMP exocytosis in cancer invasion

Valentina Marchesin et al. J Cell Biol. .

Abstract

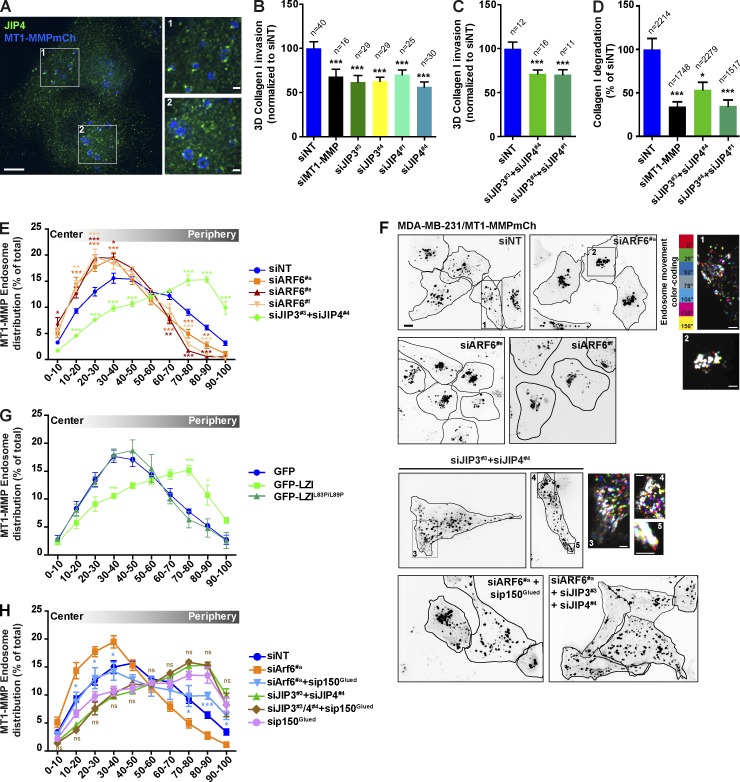
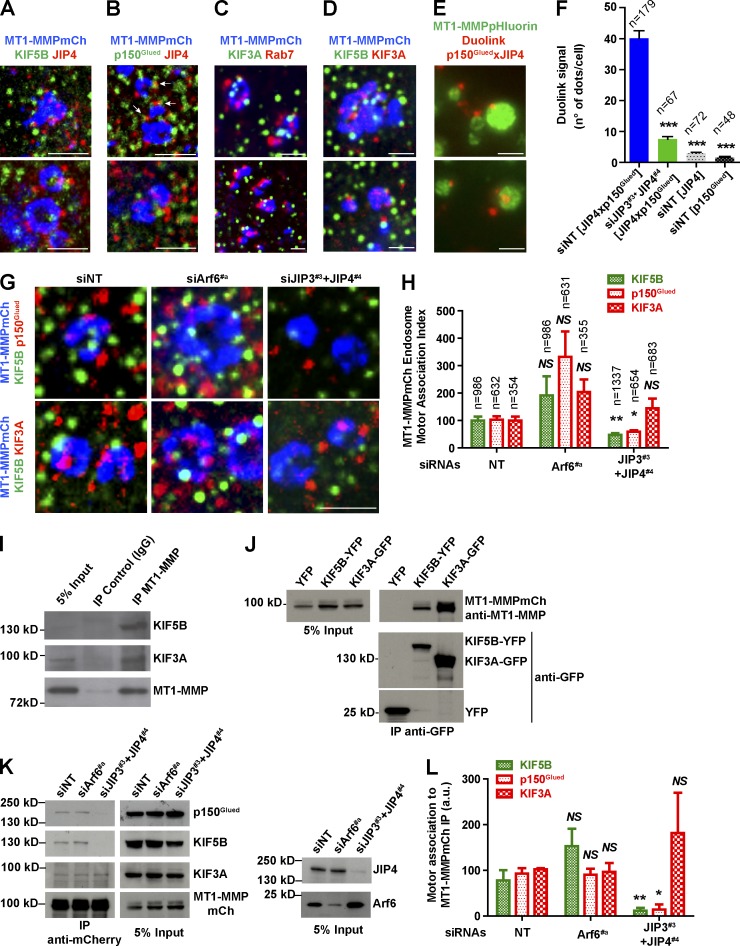
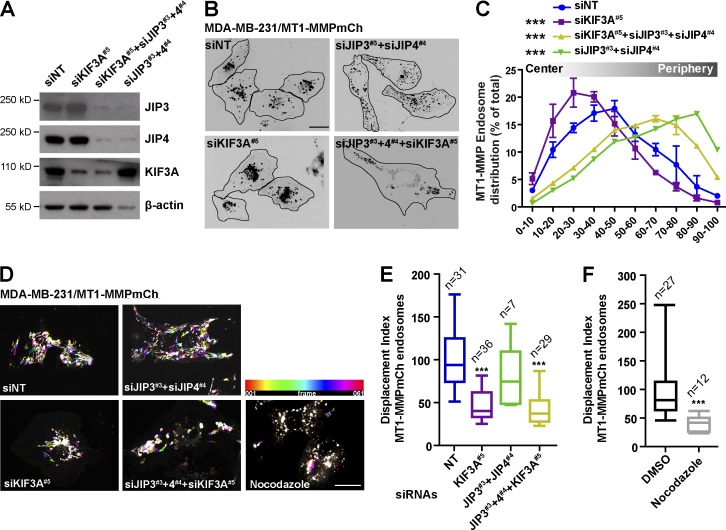
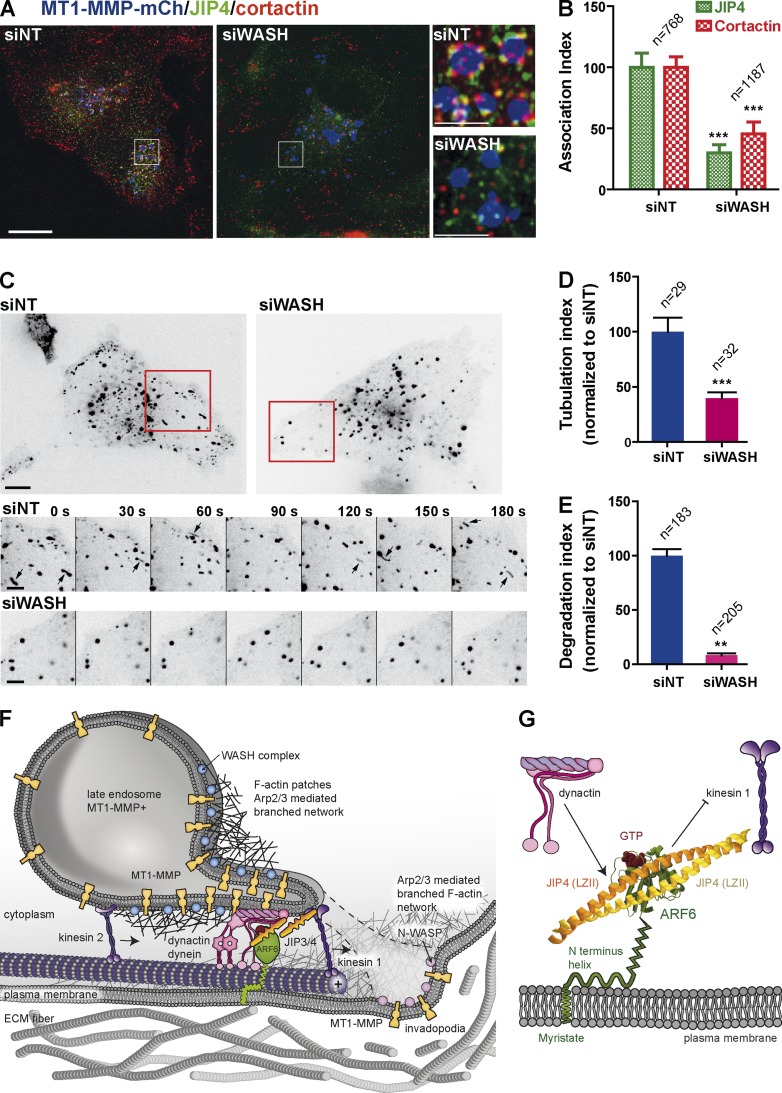
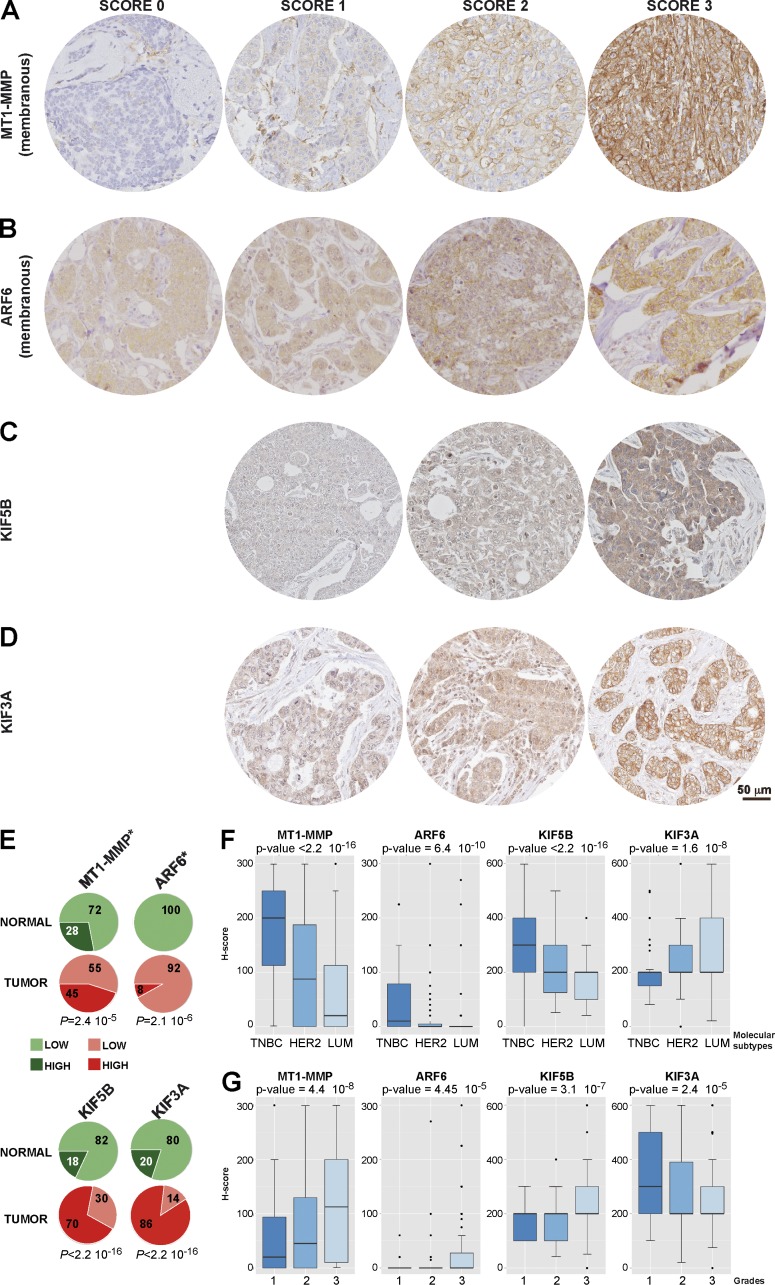
Invasion of cancer cells into collagen-rich extracellular matrix requires membrane-tethered membrane type 1-matrix metalloproteinase (MT1-MMP) as the key protease for collagen breakdown. Understanding how MT1-MMP is delivered to the surface of tumor cells is essential for cancer cell biology. In this study, we identify ARF6 together with c-Jun NH2-terminal kinase-interacting protein 3 and 4 (JIP3 and JIP4) effectors as critical regulators of this process. Silencing ARF6 or JIP3/JIP4 in breast tumor cells results in MT1-MMP endosome mispositioning and reduces MT1-MMP exocytosis and tumor cell invasion. JIPs are recruited by Wiskott-Aldrich syndrome protein and scar homologue (WASH) on MT1-MMP endosomes on which they recruit dynein-dynactin and kinesin-1. The interaction of plasma membrane ARF6 with endosomal JIPs coordinates dynactin-dynein and kinesin-1 activity in a tug-of-war mechanism, leading to MT1-MMP endosome tubulation and exocytosis. In addition, we find that ARF6, MT1-MMP, and kinesin-1 are up-regulated in high-grade triple-negative breast cancers. These data identify a critical ARF6-JIP-MT1-MMP-dynein-dynactin-kinesin-1 axis promoting an invasive phenotype of breast cancer cells.


Figures

Figure 1.
Figure 1.
ARF6 is required for matrix degradation and invasive migration of breast tumor cells through 3D type I collagen. (A) FITC-gelatin degradation. n, number of cells scored for each cell population treated with indicated siRNAs. ***, P < 0.001 (compared with siNT-treated cells). (B) Phalloidin-labeled MDA-MB-231 cell spheroids after 2 d in 3D collagen I (T2). Insets show spheroids immediately after embedding in collagen (T0). Bars, 200 µm. (C) Mean invasion area of spheroids at T2 normalized to mean spheroid area at T0 and to invasion of siNT spheroids set to 100 ± SEM. n, spheroid number. ***, P < 0.001. (D) MDA-MB-231 cells treated with indicated siRNAs embedded in collagen I and stained for cleaved collagen with Col1-3/4C antibody (black in the inverted image). DAPI-stained nuclei are shown in red. Bar, 20 µm. (E) Collagenolysis by MDA-MB-231 cells (Col1-3/4C antibody signal as in D). Values are mean normalized degradation index ± SEM. n, number of cells analyzed for each cell population. ***, P < 0.001 (as compared with siNT-treated cells).
Figure 2.
Figure 2.
Regulation of MT1-MMP–positive endosome positioning by ARF6 and JIP3/JIP4. (A) JIP4 staining of MT1-MMPmCh–expressing MDA-MB-231 cells. Bars: 5 µm; (insets) 2 µm. (B and C) Mean invasion area of multicellular spheroids after 2 d in 3D collagen normalized to mean spheroid area at T0 and to invasion of siNT-treated spheroids set to 100 ± SEM. n, spheroids number. ***, P < 0.001. (D) Collagenolysis by MDA-MB-231 cells treated with the indicated siRNAs. Values are mean normalized degradation index ± SEM. n, number of cells analyzed for each cell population. *, P < 0.05; ***, P < 0.001 (as compared with siNT-treated cells). (E) Distribution of MT1-MMPmCh endosomes in MDA-MB-231 cells plated on 2D gelatin. Mean percentage of MT1-MMP–positive endosomes according to their cell center-to-cell periphery position ± SEM. **, P < 0.01; ***, P < 0.001 (compared with siNT distribution). (F) Inverted still images from time-lapse sequences of MDA-MB-231 cells expressing MT1-MMPmCh treated with indicated siRNAs (see Video 1). Insets show color-coded time projections of selected time frames from these sequences (color code shown on the left of inset 1) corresponding to the boxed regions at higher magnification. Bars: 10 µm; (insets) 5 µm. (G) Distribution of MT1-MMPmCh endosomes in MDA-MB-231 cells expressing the indicated JIP3-LZI construct as in E. (H) MT1-MMPmCh endosome distribution as in E. *, P < 0.05; ***, P < 0.001 with siARF6+sip150Glued as compared with siARF6 treatment and siJIP3/4+sip150Glued as compared with siJIP3/4. ns, not significant.
Figure 3.
Figure 3.
JIP3/JIP4 regulate KIF5B and p150Glued but not KIF3A association to MT1-MMP endosomes. (A–D) Association of indicated motor proteins (green and red) with MT1-MMPmCh–positive endosomes. Arrows in B point to JIP4 and p150Glued colocalization. (E) MDA-MB-231 cells expressing MT1-MMPpHluorin analyzed by in situ PLA (red) with p150Glued and JIP4 antibodies. Bars, 2 µm. (F) PLA signal in siRNA-treated cells using the indicated antibodies (in brackets). Values are mean number of PLA dots/cell ± SEM. n, number of cells analyzed for each cell population. (G) MDA-MB-231 cells expressing MT1-MMPmCh treated with the indicated siRNAs and stained for KIF5B and p150Glued (top) or KIF5B and KIF3A (bottom). Bar, 2 µm. (H) Motor protein association (KIF5B, p150Glued, or KIF3A) with MT1-MMP–positive compartments compared with association in siNT-treated control cells (see Materials and methods section 3D deconvolution microscopy). n, number of endosomes analyzed for each cell population. (I) Detection of KIF5B and KIF3A endogenous proteins in anti–MT1-MMP immunoprecipitates (IPs) from MDA-MB-231 cells. (J) Detection of MT1-MMPmCh in anti-GFP IPs of YFP, KIF5B-YFP, or KIF3A-GFP. (K) Detection of KIF5B, p150Glued, and KIF3A motor proteins in MT1-MMPmCh IPs from MDA-MB-231 cells transfected with the indicated siRNAs. (L) Quantification of motor association from immunoblotting analysis as in I. Levels in siNT control cells were set to 100. *, P < 0.05; **, P < 0.01; ***, P < 0.001 (as compared with siNT-treated cells).
Figure 4.
Figure 4.
KIF3A mediates peripheral distribution of the MT1-MMP endosome in JIP3/JIP4-depleted cells. (A) Silencing of KIF3A and JIP3/4 in MT1-MMPmCh–expressing MDA-MB-231 cells. β-Actin was used as a loading control. (B) Inverted still images from time-lapse sequences of MDA-MB-231 cells expressing MT1-MMPmCh endosomes treated with the indicated siRNAs (see Video 2). Bar, 5 µm. (C) Mean percentage distribution of MT1-MMPmCh–positive endosomes according to their cell center-to-cell periphery position ± SEM. ***, P < 0.001 (compared with siNT-treated cells). (D) Color-coded time projections of 61 consecutive time frames from time-lapse sequences of MDA-MB-231 cells expressing MT1-MMPmCh (acquired with 3-s intervals). Bar, 5 µm. (E and F) Displacement index of MT1-MMP–positive endosomes in indicated cell populations. ***, P < 0.001 (compared with siNT-treated cells in E or DMSO-treated cells in F). n, number of scored cells.
Figure 5.
Figure 5.
KIF5B and KIF3A are required for pericellular matrix remodeling and MT1-MMP exocytosis. (A–C) Silencing of KIF5B, KIF3A, and MT1-MMP in MDA-MB-231 cells. β-Actin was used as a loading control. (D) FITC-gelatin degradation. n, number of cells scored for each MDA-MB-231 cell population treated with the indicated siRNA. (E) Mean invasion area of MDA-MB-231 cells using the circular invasion assay. Values represent mean invasion index ± SEM from three independent experiments normalized to invasion index of siNT-treated cells set to 100. n, number of 96 wells analyzed for each cell population. (F) FITC-gelatin degradation by MCF10DICIS.com cells treated with indicated siRNAs as in D. (G) Invasion of MCF10DICIS.com cells as in E. (H) Collagenolysis by MDA-MB-231 cells treated with indicated siRNAs. Values are mean normalized degradation index ± SEM. n, number of cells analyzed for each cell population. (I) MDA-MB-231 cells expressing MT1-MMPpHluorin silenced for the indicated proteins were seeded on type I collagen fibers and imaged over a 30-min time period. Frequency of MT1-MMPpHluorin exocytic events was quantified (events/cell/minute). n, number of cells analyzed for each cell population. *, P < 0.05; ***, P < 0.001 (as compared with siNT-treated cells).
Figure 6.
Figure 6.
Stimulation of matrix degradation by KIF5B correlates with increased ARF6-, JIP3/4-, and p150Glued-dependent endosome tubulogenesis. (A) Inverted still images from time-lapse sequences of MDA-MB-231 cells expressing KIF5B-YFP and MT1-MMPmCh treated with the indicated siRNAs (see Video 3). Bar, 10 µm. (B) Mean percentage distribution of MT1-MMPmCh–positive endosomes according to their cell center-to-cell periphery position ± SEM. (C) FITC-gelatin degradation by MDA-MB-231 cells overexpressing MT1-MMPmCh together with YFP or KIF5B-YFP. n, number of cells scored for each MDA-MB-231 cell population treated with the indicated siRNAs. (B and C) ***, P < 0.001 (as compared with siNT-treated cells). (D) High-magnification galleries of peripheral cell regions (boxed in A). Arrows point to tubulated MT1-MMP endosomes. Bar, 5 µm. (E) TIRF microscopy images of MDA-MB-231 cells expressing MT1-MMPmCh and KIF5B-YFP plated on gelatin. Gallery shows images with 0.2-s intervals corresponding to the boxed region. Arrows point to membrane tubulation events. Bars: 5 µm; (gallery) 2 µm. (F and G) Number of tubulated MT1-MMPmCh endosomes per frame normalized for the surface area. Mean ± SEM. n, number of peripheral cell regions scored for each cell population. *, P < 0.05; **, P < 0.01 (as compared with siNT condition).
Figure 7.
Figure 7.
JIP4 recruitment on MT1-MMP–positive endosomes depends on WASH. (A) JIP4 and cortactin staining of MDA-MB-231 cells expressing MT1-MMPmCh treated with the indicated siRNAs. Bars: 5 µm; (insets) 1.25 µm. (B) JIP4 and cortactin association with MT1-MMPmCh–positive endosomes as in Fig. 3 H. ***, P < 0.001 (as compared with siNT-treated cells in which association was set to 100). (C) Inverted still images from time-lapse sequences of MDA-MB-231 cells expressing KIF5B-YFP and MT1-MMPmCh treated with the indicated siRNAs. Bar, 10 µm. Galleries show images with 30-s intervals corresponding to the boxed regions. Arrows point to tubulated endosomes. Bar, 5 µm. (D) Quantification of tubulation from time-lapse sequences as in C. All values are mean ± SEM. n, number of cell regions scored for each cell population. ***, P < 0.001 (as compared with siNT-treated cells). (E) FITC-gelatin degradation by MDA-MB-231 cells overexpressing MT1-MMPmCh and KIF5B-YFP treated with indicated siRNAs. n, number of cells scored for each cell population. **, P < 0.01 (compared with siNT-treated cells). (F) Scheme depicting ARF6 and JIP3/JIP4-mediated regulation of a kinesin-1 and dynactin–dynein tug of war leading to MT1-MMP endosome tubulation and surface delivery of MT1-MMP (see Discussion). (G) Model of trans-interaction between plasma membrane GTP-ARF6 and endosomal JIP4. ARF6 myristoylated amphipatic N-terminal helix is indicated as a green cylinder lying against the plasma membrane. Only the second coiled coil domain of JIP4 is shown. Binding of GTP-ARF6 to JIP4 dimer is compatible with the dynactin–dynein interaction with JIP4, whereas it prevents kinesin-1 interaction (based on structural and biochemical data; Isabet et al., 2009; Montagnac et al., 2009).
Figure 8.
Figure 8.
ARF6 expression increases during breast tumor progression. (A) ARF6 expression in representative regions of in situ (top) and invasive components (bottom) of IDC of the indicated molecular subtypes stained for ARF6 by IHC. LUM, hormone receptor positive (Luminal A + B); TNBC, hormone receptor negative, HER2 negative; HER2, hormone receptor negative, HER2 positive. Insets are higher magnification of boxed regions. Bars, 10 µm. (B and C) Semiquantitative analysis of cytosolic (B) and membranous ARF6 expression (C) by the H-score method comparing peritumoral breast epithelial tissue (n = 324), in situ (n = 131), and invasive (n = 426) components of IDCs. Comparisons were made with the Kruskal-Wallis test. **, P < 0.01; ***, P < 0.001.
Figure 9.
Figure 9.
Membranous ARF6 and MT1-MMP and KIF5B and KIF3A expression in breast cancer. (A–D) Expression of membranous MT1-MMP (A), membranous ARF6 (B), KIF5B (C), and KIF3A (D) was measured by IHC on TMA (example of score assignment). (E) Expression of MT1-MMP, ARF6, KIF5B, and KIF3A segregated in low- and high-expression classes is significantly increased in tumor component of IDCs as compared with adjacent peritumoral area. Values are shown as percentage of total tumors. *, membranous signal was considered. (F and G) Box plot representation with maximum and minimum, 75th and 25th percentiles, and median values of H score of the different markers correlating with the molecular subtypes (F) and pathological grades (G). Analysis was performed on 311 cases for which scores were available for all four markers. ARF6 and MT1-MMP plasma membrane H scores and total (cytosol + plasma membrane) KIF5B and KIF3A H scores were considered.
Figure 10.
Figure 10.
ARF6, MT1-MMP, and KIF5B are up-regulated in TNBCs. (A–D) IHC analysis of MT1-MMP, ARF6, KIF5B, and KIF3A in IDCs. Insets show the peritumoral area. Bars: 25 µm; (insets) 10 µm. (E) Hierarchical clustering of the staining patterns of 311 IDC samples based on total KIF3A and KIF5B, and membranous ARF6 and MT1-MMP expression. Data are shown in a table format with the vertical axis listing IDC samples and bars representing antibodies. A color scale, which represents relative staining patterns of each sample, is displayed at the top left corner. Molecular subtypes (HER2, TNBC, and Luminal A + B) and grades are depicted between clusters and dendrogram, with color coding annotated at the bottom left corner.

Comment in

Similar articles

Cited by

References

    1. Artym V.V., Zhang Y., Seillier-Moiseiwitsch F., Yamada K.M., and Mueller S.C.. 2006. Dynamic interactions of cortactin and membrane type 1 matrix metalloproteinase at invadopodia: defining the stages of invadopodia formation and function. Cancer Res. 66:3034–3043. 10.1158/0008-5472.CAN-05-2177 - DOI - PubMed
    1. Bonnans C., Chou J., and Werb Z.. 2014. Remodelling the extracellular matrix in development and disease. Nat. Rev. Mol. Cell Biol. 15:786–801. 10.1038/nrm3904 - DOI - PMC - PubMed
    1. Bowman A.B., Kamal A., Ritchings B.W., Philp A.V., McGrail M., Gindhart J.G., and Goldstein L.S.. 2000. Kinesin-dependent axonal transport is mediated by the sunday driver (SYD) protein. Cell. 103:583–594. 10.1016/S0092-8674(00)00162-8 - DOI - PubMed
    1. Castro-Castro A., Janke C., Montagnac G., Paul-Gilloteaux P., and Chavrier P.. 2012. ATAT1/MEC-17 acetyltransferase and HDAC6 deacetylase control a balance of acetylation of alpha-tubulin and cortactin and regulate MT1-MMP trafficking and breast tumor cell invasion. Eur. J. Cell Biol. 91:950–960. 10.1016/j.ejcb.2012.07.001 - DOI - PubMed
    1. Cavalli V., Kujala P., Klumperman J., and Goldstein L.S.. 2005. Sunday Driver links axonal transport to damage signaling. J. Cell Biol. 168:775–787. 10.1083/jcb.200410136 - DOI - PMC - PubMed

Publication types

MeSH terms