. 2015 Nov 10;112(45):13892-7.
doi: 10.1073/pnas.1518285112. Epub 2015 Oct 26.

Why significant variables aren't automatically good predictors

Affiliations

Why significant variables aren't automatically good predictors

Adeline Lo et al. Proc Natl Acad Sci U S A. .

Abstract

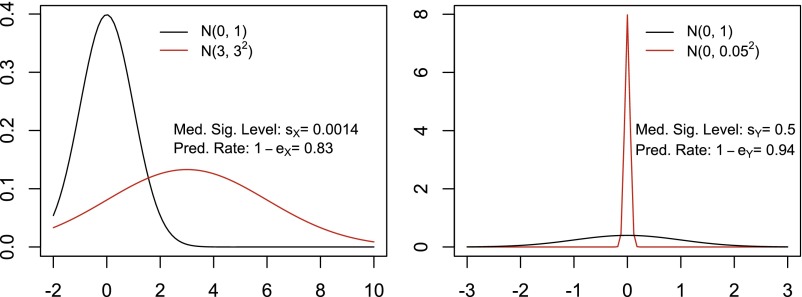
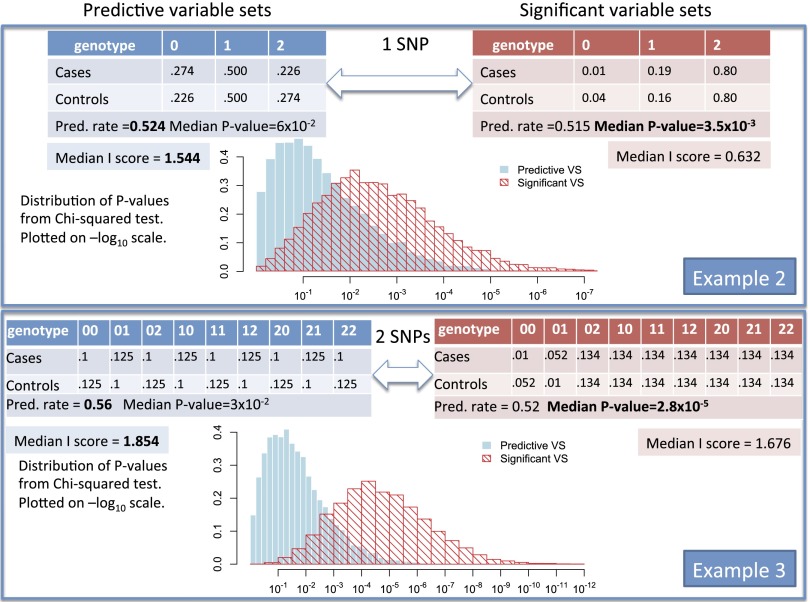
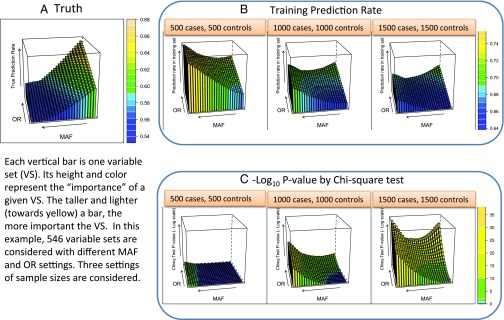
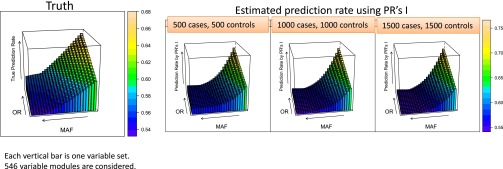
Thus far, genome-wide association studies (GWAS) have been disappointing in the inability of investigators to use the results of identified, statistically significant variants in complex diseases to make predictions useful for personalized medicine. Why are significant variables not leading to good prediction of outcomes? We point out that this problem is prevalent in simple as well as complex data, in the sciences as well as the social sciences. We offer a brief explanation and some statistical insights on why higher significance cannot automatically imply stronger predictivity and illustrate through simulations and a real breast cancer example. We also demonstrate that highly predictive variables do not necessarily appear as highly significant, thus evading the researcher using significance-based methods. We point out that what makes variables good for prediction versus significance depends on different properties of the underlying distributions. If prediction is the goal, we must lay aside significance as the only selection standard. We suggest that progress in prediction requires efforts toward a new research agenda of searching for a novel criterion to retrieve highly predictive variables rather than highly significant variables. We offer an alternative approach that was not designed for significance, the partition retention method, which was very effective predicting on a long-studied breast cancer data set, by reducing the classification error rate from 30% to 8%.

Keywords: high-dimensional data; prediction; statistical significance; variable selection classification.


Conflict of interest statement

The authors declare no conflict of interest.

Figures

Fig. 1.
Fig. 1.
Simple example of reversals.
Fig. 2.
Fig. 2.
Reversals of predictive and significant variable sets in SNP examples. Example 2 has one explanatory variable (1 SNP) for which the probabilities under cases and controls are listed in the tables. Example 3 has two explanatory variables (2 SNPs) for which the probabilities under cases and controls are listed in the tables. Left-hand-side tables (in blue) are for more predictive variable sets, whereas right-hand-side tables (in red) are for more significant variable sets. The prediction rate (proportion of correct predictions) of each variable set (of size 1 or 2) can be directly computed using the genotype frequencies specified. Using sample sizes of 500 cases and 500 controls, we simulate B=1,000 random case-control data sets by simulating genotype counts among cases and controls using the genotype frequencies specified. I score and the χ2 test statistic were computed for each simulated data set. Simulation details can be found in the Supporting Information.
Fig. 3.
Fig. 3.
Disconnect between true prediction power of a variable set and its empirical training set prediction rate and test-based significance. We use 546 variable sets of 6 SNPs with varying levels of disease information (both MAFs and ORs). This results in a partition of 729 cells, each corresponding to a genotype combination on the 6 SNPs represented by this variable set. Three levels of sample size are considered, 500 cases and 500 controls, 1,000 cases and 1,000 controls, and 1,500 cases and 1,500 controls. For each variable set, the theoretical Bayes rate is computed based on the population frequencies and odds ratios. Two thousand independent simulations under each variable sets—given a sample size specification—were used to evaluate the average training prediction error, P value from the χ2 test, and the I-score prediction rate. A depicts the true prediction rate for each of the 546 variable sets for the varying OR and MAF levels. B shows the corresponding training prediction rate as the sample size increases from 500 cases and 500 controls up to 1,500 cases and 1,500 controls. C depicts the corresponding χ2 test P value for each of the variable sets across the three sample sizes. Simulation details can be found in the Supporting Information.
Fig. 4.
Fig. 4.
Proposed estimated prediction rate based on I scores correlates well with the truth.

References

    1. Anonymous Predicting the influence of common variants. Nat Genet. 2013;45(4):339. - PubMed
    1. Clayton DG. Prediction and interaction in complex disease genetics: Experience in type 1 diabetes. PLoS Genet. 2009;5(7):e1000540. - PMC - PubMed
    1. de los Campos G, Gianola D, Allison DB. Predicting genetic predisposition in humans: The promise of whole-genome markers. Nat Rev Genet. 2010;11(12):880–886. - PubMed
    1. Jakobsdottir J, Gorin MB, Conley YP, Ferrell RE, Weeks DE. Interpretation of genetic association studies: Markers with replicated highly significant odds ratios may be poor classifiers. PLoS Genet. 2009;5(2):e1000337. - PMC - PubMed
    1. Janssens AC, van Duijn CM. Genome-based prediction of common diseases: advances and prospects. Hum Mol Genet. 2008;17(R2):R166–R173. - PubMed

Publication types

LinkOut - more resources