Global nutrient transport in a world of giants
- PMID: 26504209
- PMCID: PMC4743783
- DOI: 10.1073/pnas.1502549112
Global nutrient transport in a world of giants
Abstract
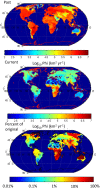
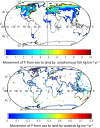
The past was a world of giants, with abundant whales in the sea and large animals roaming the land. However, that world came to an end following massive late-Quaternary megafauna extinctions on land and widespread population reductions in great whale populations over the past few centuries. These losses are likely to have had important consequences for broad-scale nutrient cycling, because recent literature suggests that large animals disproportionately drive nutrient movement. We estimate that the capacity of animals to move nutrients away from concentration patches has decreased to about 8% of the preextinction value on land and about 5% of historic values in oceans. For phosphorus (P), a key nutrient, upward movement in the ocean by marine mammals is about 23% of its former capacity (previously about 340 million kg of P per year). Movements by seabirds and anadromous fish provide important transfer of nutrients from the sea to land, totalling ∼150 million kg of P per year globally in the past, a transfer that has declined to less than 4% of this value as a result of the decimation of seabird colonies and anadromous fish populations. We propose that in the past, marine mammals, seabirds, anadromous fish, and terrestrial animals likely formed an interlinked system recycling nutrients from the ocean depths to the continental interiors, with marine mammals moving nutrients from the deep sea to surface waters, seabirds and anadromous fish moving nutrients from the ocean to land, and large animals moving nutrients away from hotspots into the continental interior.
Keywords: anadromous fish; biogeochemical cycling; extinctions; megafauna; whales.
Conflict of interest statement
The authors declare no conflict of interest.
Figures


References
-
- Barnosky AD, Koch PL, Feranec RS, Wing SL, Shabel AB. Assessing the causes of late Pleistocene extinctions on the continents. Science. 2004;306(5693):70–75. - PubMed
-
- Dirzo R, et al. Defaunation in the Anthropocene. Science. 2014;345(6195):401–406. - PubMed
-
- Christensen LB. Marine mammal populations: Reconstructing historical abundances at the global scale. Fisheries Centre Research Reports. 2006;14(9):1–161.
-
- Branch TA, Williams TM. Legacy of industrial whaling: Could killer whales be responsible for declines of sea lions, elephant seals, and Minke whales in the Southern Hemisphere? In: Estes JA, DeMaster DP, Doak DF, Williams TM, Brownell RL, editors. Whales, Whaling, and Ocean Ecosystems. Univ of California Press; Oakland, CA: 2007. pp. 262–278.
Publication types
MeSH terms
Grants and funding
LinkOut - more resources
Full Text Sources
Other Literature Sources
Miscellaneous

