. 2015 Aug 26:2:15037.
doi: 10.1038/hortres.2015.37. eCollection 2015.

Comparative transcriptomics of Central Asian Vitis vinifera accessions reveals distinct defense strategies against powdery mildew

Affiliations

Comparative transcriptomics of Central Asian Vitis vinifera accessions reveals distinct defense strategies against powdery mildew

Katherine C H Amrine et al. Hortic Res. .

Abstract

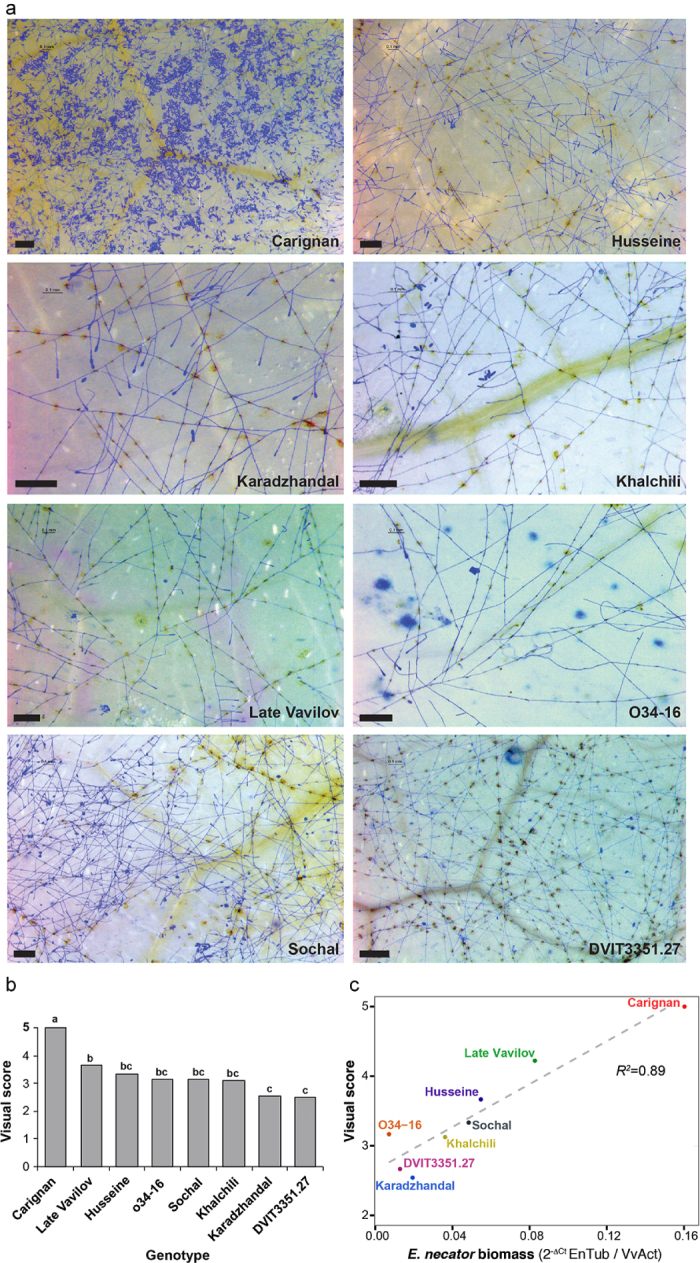
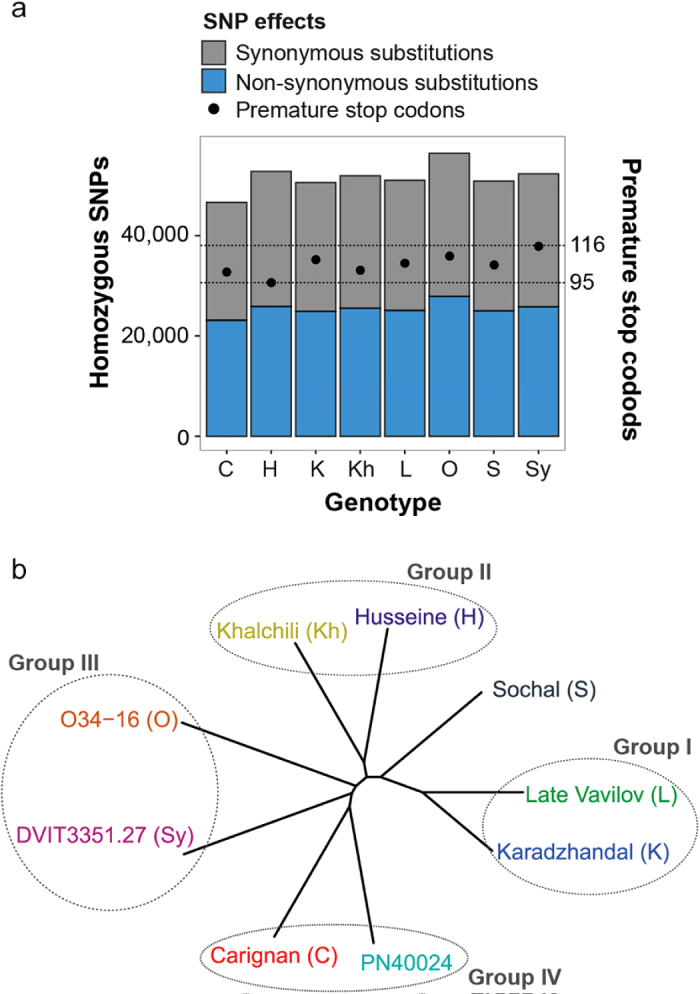
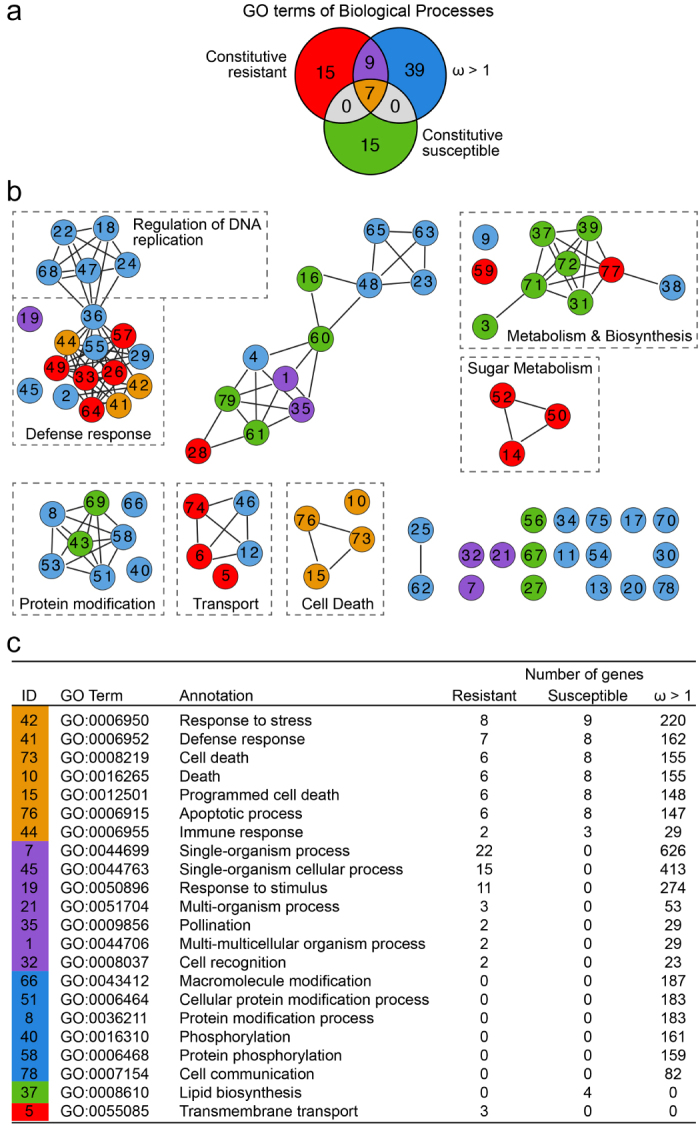
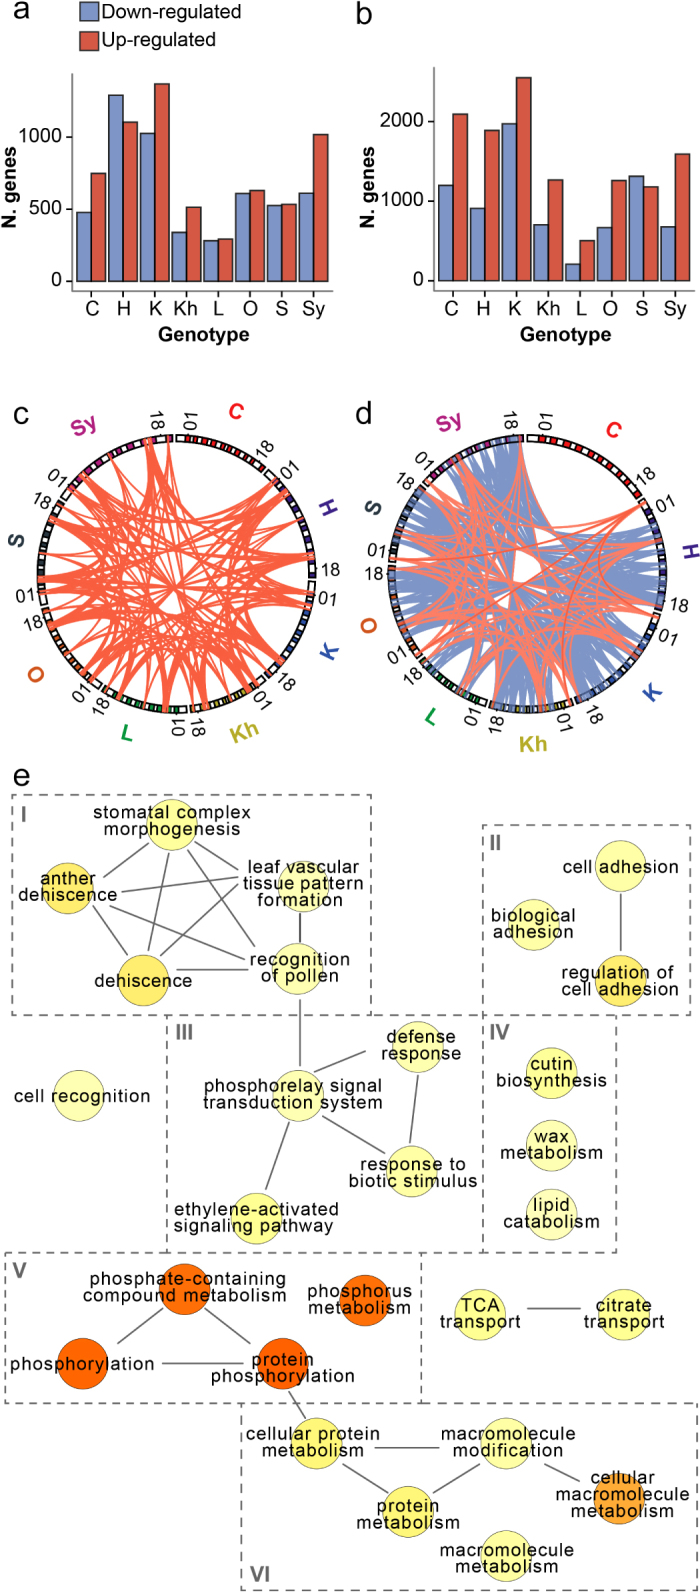
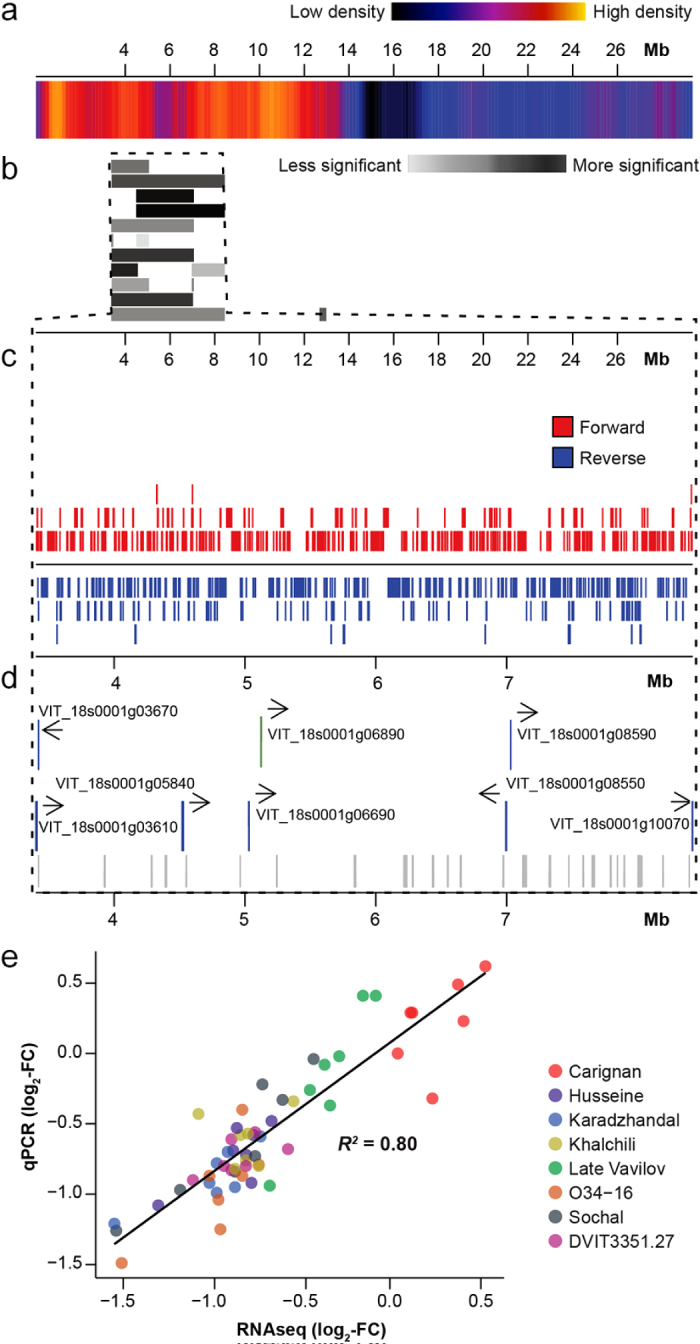
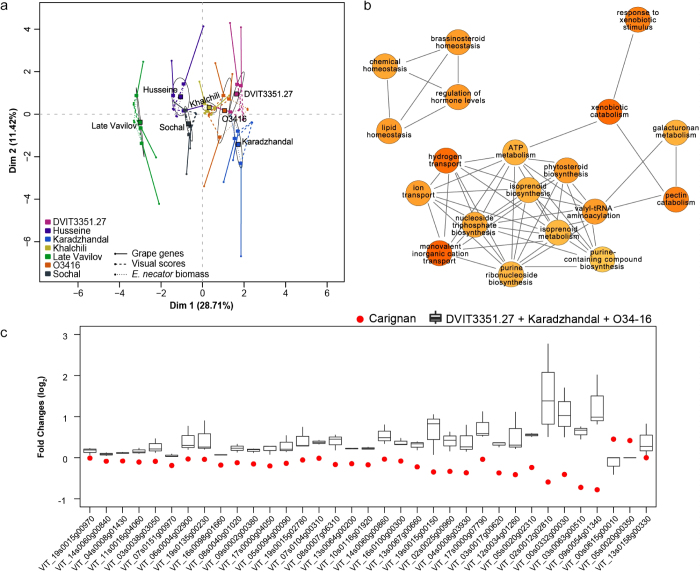
Grape powdery mildew (PM), caused by the biotrophic ascomycete Erysiphe necator, is a devastating fungal disease that affects most Vitis vinifera cultivars. We have previously identified a panel of V. vinifera accessions from Central Asia with partial resistance to PM that possess a Ren1-like local haplotype. In this study, we show that in addition to the typical Ren1-associated late post-penetration resistance, these accessions display a range of different levels of disease development suggesting that alternative alleles or additional genes contribute to determining the outcome of the interaction with the pathogen. To identify potential Ren1-dependent transcriptional responses and functions associated with the different levels of resistance, we sequenced and analyzed the transcriptomes of these Central Asian accessions at two time points of PM infection. Transcriptomes were compared to identify constitutive differences and PM-inducible responses that may underlie their disease resistant phenotype. Responses to E. necator in all resistant accessions were characterized by an early up-regulation of 13 genes, most encoding putative defense functions, and a late down-regulation of 32 genes, enriched in transcriptional regulators and protein kinases. Potential Ren1-dependent responses included a hotspot of co-regulated genes on chromosome 18. We also identified 81 genes whose expression levels and dynamics correlated with the phenotypic differences between the most resistant accessions 'Karadzhandahal', DVIT3351.27, and O34-16 and the other genotypes. This study provides a first exploration of the functions associated with varying levels of partial resistance to PM in V. vinifera accessions that can be exploited as sources of genetic resistance in grape breeding programs.


Figures

Figure 1
Figure 1
Characterization of PM susceptibility in the eight V. vinifera cv (a) Micrographs of E. necator infection at 14 dpi. Bars = 0.2 mm (b) Mean visual scores of PM susceptibility in the eight cultivars. Different letters depict significant differences based on ANOVA followed by Tukey’s HSD test (P ≤ 0.05). (c) Correlation between visual scores of disease susceptibility and E. necator biomass measured by qPCR.
Figure 2
Figure 2
Genetic diversity of the sequenced transcriptomes (a) Barplots showing the total number of homozygous SNPs resulting in synonymous or non-synonymous substitutions, or premature stop codons (b) Unrooted phylogenetic tree obtained from multiple alignment of synthetic transcripts reconstructed by incorporating the detected homozygous SNPs. Based on relatedness, genotypes were assigned to four groups.
Figure 3
Figure 3
GO term enrichment overlap between genes under positive selection (ω > 1), genes with higher constitutive expression in the Central Asian accessions, and genes with higher constitutive expression in ‘Carignan’ (a) Venn diagram showing numbers of overlapping and specific GO terms in each of the three groups of genes. (b) Graphical representation of relationships between enriched GO terms. To highlight closely related enriched GO terms, terms were organized in undirected sub-graphs using the REViGO web server. Colors indicate the gene group in which the GO terms are enriched, consistent with panel A. Dashed boxes indicate similar biological functions among the GO terms. Supplementary Dataset S3 provides all the GO terms and numeric IDs that are not described in panel C. (c) GO Categories with the greatest number of gene members are listed for each gene group, with the color coding of column 1 consistent with the gene groups shown in panel (a). Column 1 identifiers correspond to the circles in panel (b).
Figure 4
Figure 4
Transcriptional responses to PM infection in the Central Asian accessions Barplots indicating the number of differentially regulated genes (P <0.05) at 1 (a) and 5 (b) dpi. Circos plots showing common differentially expressed genes between at least 6 resistant accessions at 1 (c) and 5 (d) dpi. Red and blue lines represent common up- and down-regulated genes, respectively. External bands correspond to each of the 19 chromosomes (+ Chr00) where the genes are located. A full list of genes represented by the connections in (c) and (d) are listed in Table 2. (e) Enriched GO terms (P <0.05) within the set of resistant-specific genes listed in Table 2. Darker colored circles represent terms with lower P values. Organization of sub-graphs is determined by REViGO web server. Boxes around terms group terms based on functional similarities, including (I) plant growth, (II) cell adhesion, (III) defense responses, (IV), cuticle formation, (V) phosphorylation, and (VI) cellular metabolism.
Figure 5
Figure 5
Genomic region with significant enrichment in PM-responsive genes in the Central Asian accessions. (a) Heatmap showing gene density along chromosome 18. Colors range from dark blue (smaller gene density) to red (greater gene density). (b) Graphical representation of the PGE analysis results. Bars represent regions of chromosome 18 with significant enrichment in differentially expressed genes (P < 0.05). (c) Graphical representation of the location of protein-coding genes in the region identified by PGE analysis. Each box represents the exon of a protein-coding gene. (d) Locations of genes that are either detected as differentially expressed specifically in the Central Asian accessions in response to E. necator (blue) or constitutively more expressed in the Central Asian accessions than in ‘Carignan’. Gray boxes identify genes in the same regions that are under positive selection (ω > 1). (e) Correlation between PM-induced fold-changes measured by qRT-PCR and RNAseq.
Figure 6
Figure 6
Specific responses to PM among the most resistant Central Asian accessions (a) Multiple factor analysis (MFA) of the seven PM-partially resistant genotypes using three variables: log2 fold-changes of differentially expressed genes, PM visual scores, and E. necator biomass measured by qPCR (as previously reported in Figure 1). Each point represents a biological replicate for a given genotype. Ellipses define confidence areas (95%) for each genotype, while black squares represent their correspondent center of gravity. DIM, dimension. (b) Enriched GO terms (P < 0.05) in the set of genes that drive the separation of ‘Karadzhandal’, DVIT3351.27, and O34-16 in the MFA (R > 0.7, P < 0.01). To highlight closely related enriched GO terms, terms were organized into undirected sub-graphs using the REViGO web server. (c) Genes correlated with the most resistant accessions (positive dimension 1) in Panel (a), which also present a contrasting expression pattern in the susceptible ‘Carignan’ accession.

References

    1. Nail WR, Howell GS. Effects of powdery mildew of grape on carbon assimilation mechanism of potted ‘Chardonnay’ grapevines. Hortscience 2004; 39: 1670–1673.
    1. Stummer BE, Francis IL, Zanker T, Lattey KA, Scott ES. Effects of powdery mildew on the sensory properties and composition of Chardonnay juice and wine when grape sugar ripeness is standardised. Aust J Grape Wine R 2005; 11: 66–76.
    1. Eurostat. The use of plant protection products in the European Union: data 1992–2003. Luxembourg: Office for Official Publications of the European Communities, 2007.
    1. Fuller KB, Alston JM, Sambucci OS. The value of powdery mildew resistance in grapes: evidence from California. Wine Econ Policy 2014; 3: 90–107.
    1. Jones L, Riaz S, Morales-Cruz A, Amrine KC, McGuire B et al. Adaptive genomic structural variation in the grape powdery mildew pathogen. Erysiphe necator. BMC 2014; 15: 1081. - PMC - PubMed