

Variations in zonal fruit starch concentrations of apples - a developmental phenomenon or an indication of ripening?
- PMID: 26504584
- PMCID: PMC4604666
- DOI: 10.1038/hortres.2015.47
Variations in zonal fruit starch concentrations of apples - a developmental phenomenon or an indication of ripening?
Abstract
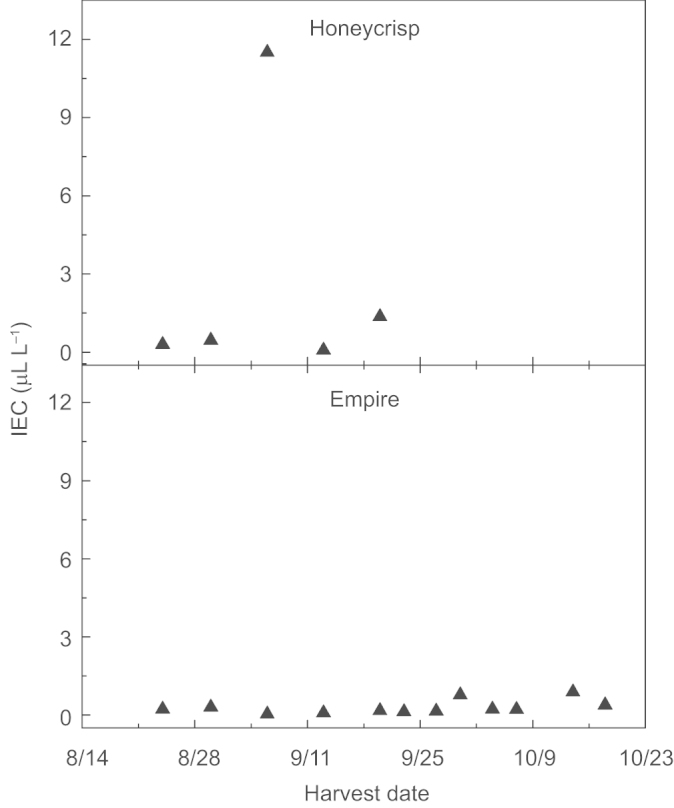
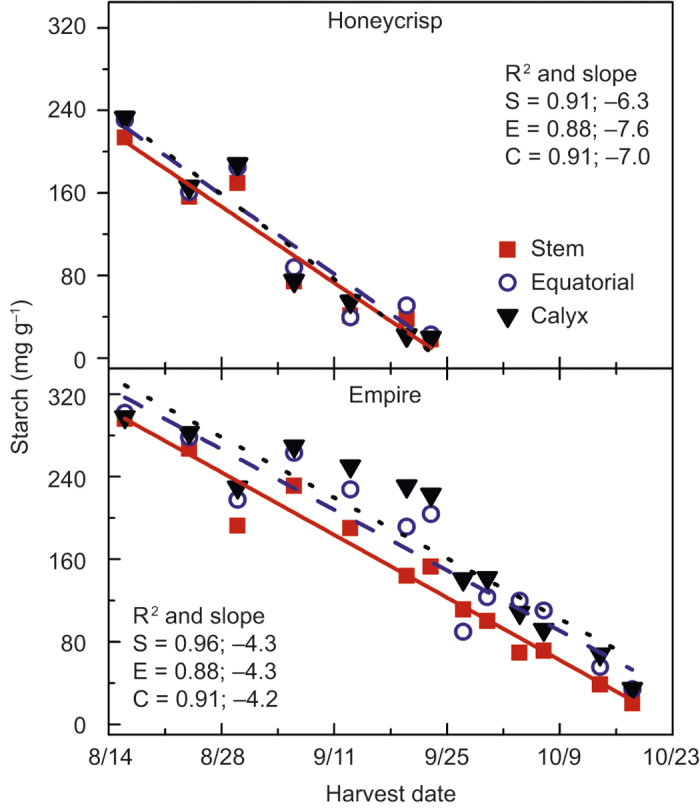
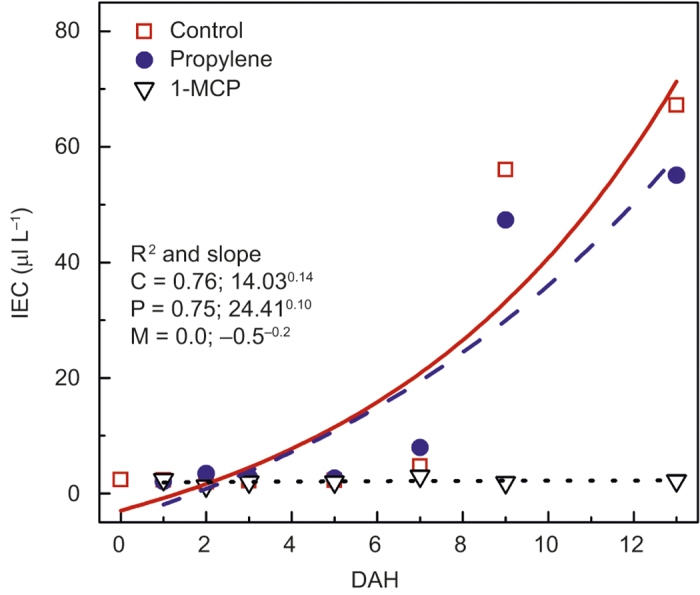
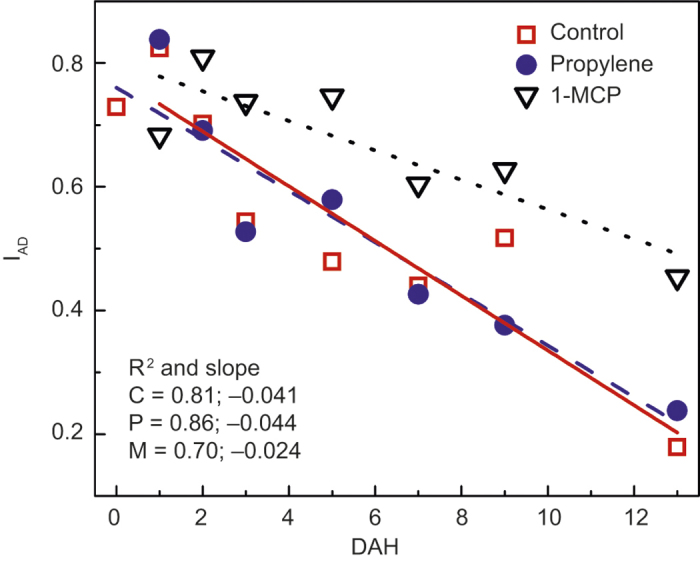
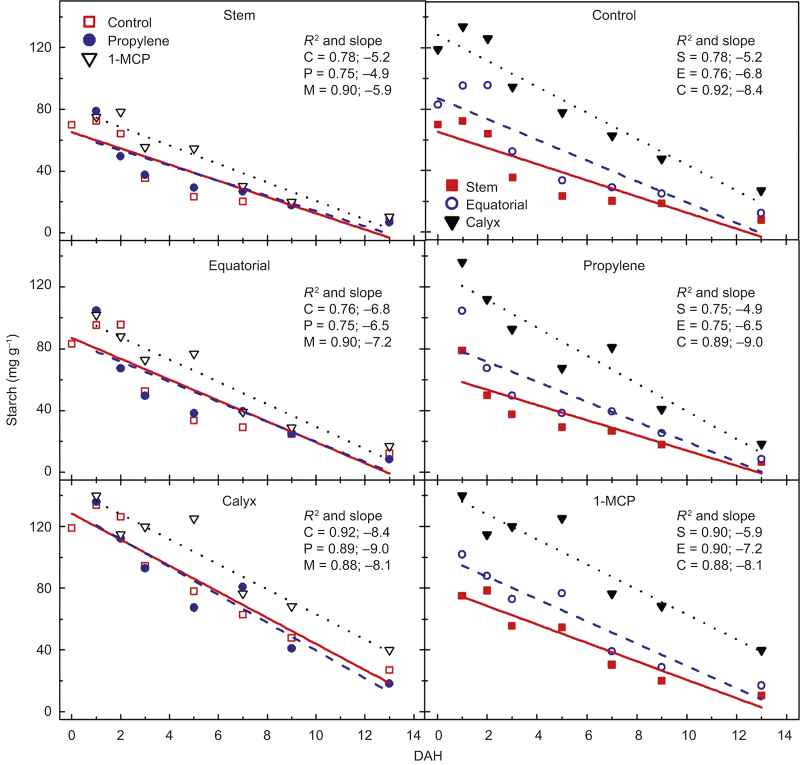
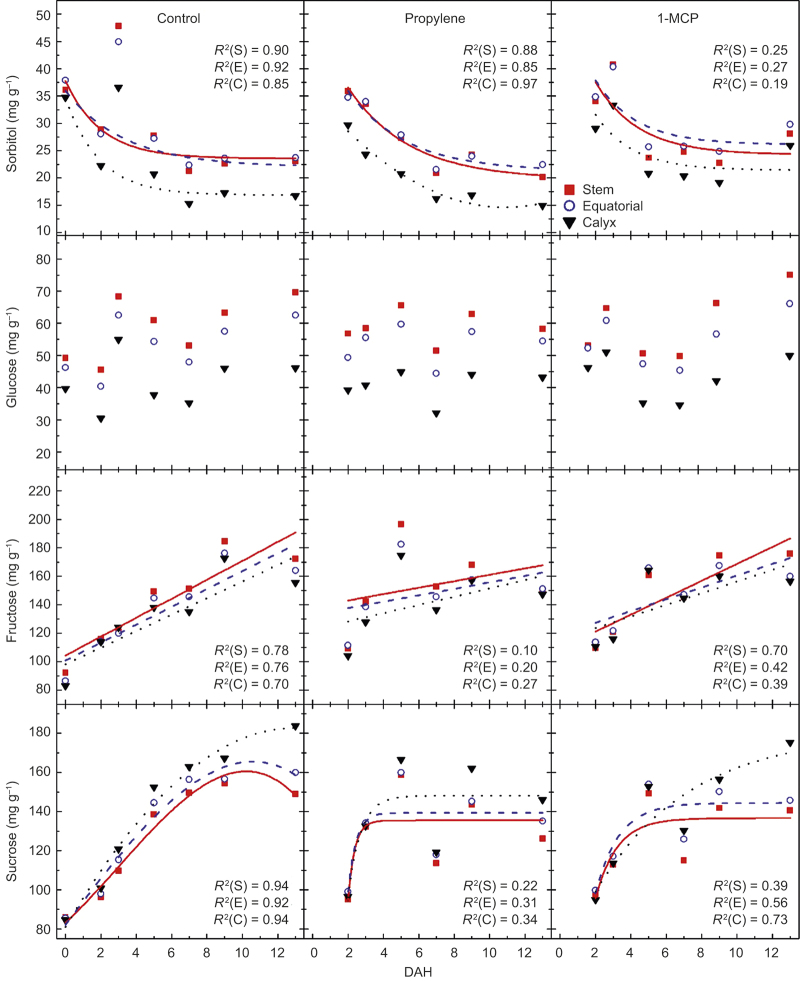
Patterns of starch hydrolysis in stem, equatorial, and calyx zones of 'Honeycrisp' and 'Empire' apples (Malus sylvestris (L.) Mill var. domestica (Borkh.) Mansf.) during maturation and ripening, and in 'Gala' apples in response to propylene or 1-methylcyclopropene (1-MCP) treatments after harvest, were studied. Differences in zonal starch concentrations were found for 'Empire' and 'Gala' fruits, but not for 'Honeycrisp'. During maturation and ripening of 'Empire', the concentration of starch was highest in the calyx end and lowest in the stem region.</title> Differences in rates of starch hydrolysis among zones were not detected. 'Honeycrisp' and 'Empire' had the highest concentration of sorbitol in the calyx region, whereas it was highest in the stem-end region in 'Gala'. The distribution differences of glucose, fructose, and sucrose were similar in all three cultivars; higher fructose and glucose concentrations in the stem region, and higher sucrose concentrations in the calyx end of the fruit. Postharvest treatment of 'Gala' with propylene did not affect the internal ethylene concentration of the fruit but 1-MCP markedly inhibited it. Starch concentrations were highest in the calyx end but gradients of starch among zones were not changed by postharvest treatment. The rate of hydrolysis was slowed by 1-MCP treatment, but was unaffected by propylene. Postharvest treatments influenced sorbitol, glucose, and fructose concentrations. Patterns of starch concentration among the zones did not confirm differences in ripening, but reflected its uneven distribution throughout the fruit during development. Therefore, measured differences in zonal starch are most likely related to starch accumulation during fruit development, rather than differences in rates of starch degradation during ripening.
Figures
References
-
- Pratt C. Apple flower and fruit: morphology and anatomy. Hort Rev 1988; 10: 273–308.
-
- Rudell DR, Mattinson DS, Fellman JK et al. The progression of ethylene production and respiration in the tissues of ripening ‘Fuji’ apple fruit. HortScience 2000; 35: 1300–1303.
-
- Mansour R, Latché A, Vaillant V et al. Metabolism of 1-aminocyclopropane-1-carboxylic acid in ripening apple fruits. Physiol Plant 1986; 66: 495–502.
-
- Brookfield P, Murphy P, Harker R et al. Starch degradation and starch pattern indices; interpretation and relationship to maturity. Postharvest Biol Technol 1997; 11: 23–30.
LinkOut - more resources
Full Text Sources
Other Literature Sources
Miscellaneous
