. 2015 Sep 11;6(10):3941-51.
doi: 10.1364/BOE.6.003941. eCollection 2015 Oct 1.

Cerebral metabolic rate of oxygen (CMRO2) assessed by combined Doppler and spectroscopic OCT

Affiliations

Cerebral metabolic rate of oxygen (CMRO2) assessed by combined Doppler and spectroscopic OCT

Shau Poh Chong et al. Biomed Opt Express. .

Abstract

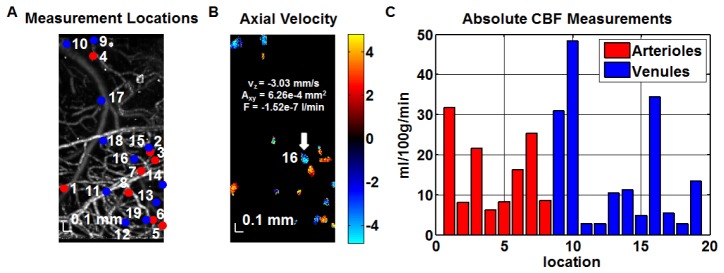
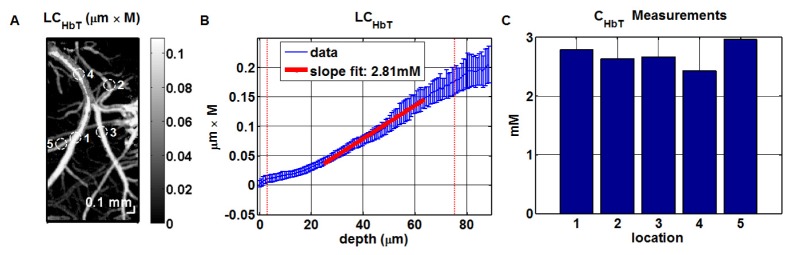
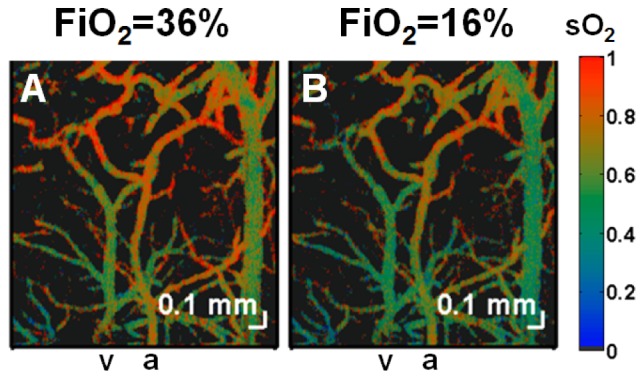
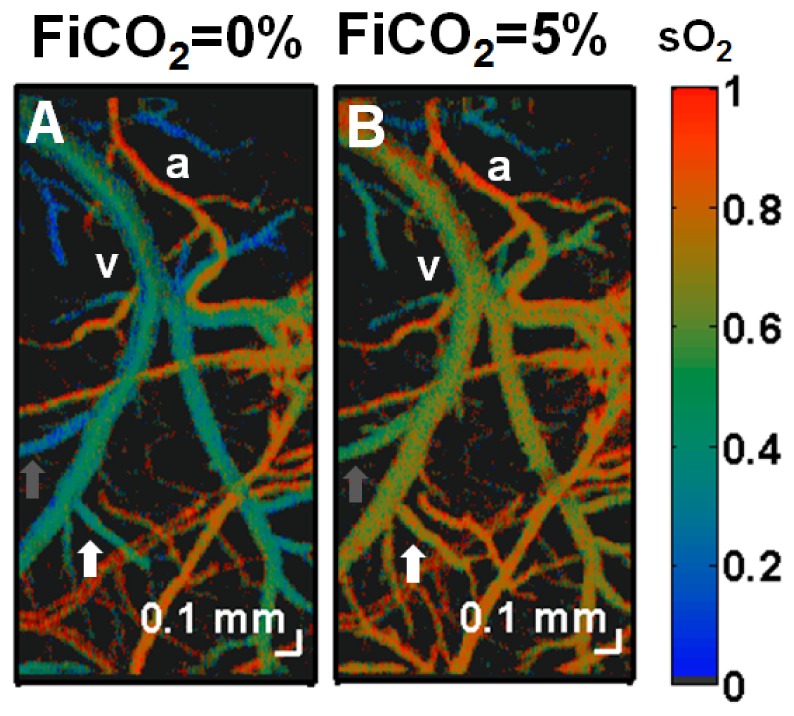
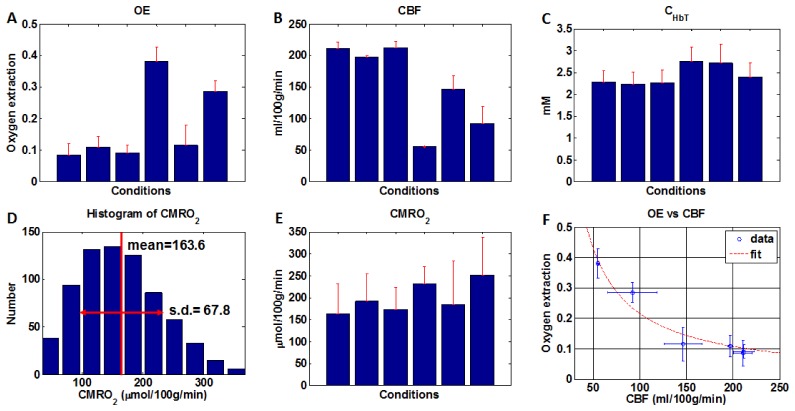
A method of measuring cortical oxygen metabolism in the mouse brain that uses independent quantitative measurements of three key parameters: cerebral blood flow (CBF), arteriovenous oxygen extraction (OE), and hemoglobin concentration ([HbT]) is presented. Measurements were performed using a single visible light spectral/Fourier domain OCT microscope, with Doppler and spectroscopic capabilities, through a thinned-skull cranial window in the mouse brain. Baseline metabolic measurements in mice are shown to be consistent with literature values. Oxygen consumption, as measured by this method, did not change substantially during minor changes either in the fraction of inspired oxygen (FiO2) or in the fraction of inspired carbon dioxide (FiCO2), in spite of larger variations in oxygen saturations. This set of experiments supports, but does not prove, the validity of the proposed method of measuring brain oxygen metabolism.

Keywords: (110.4500) Optical coherence tomography; (170.0180) Microscopy; (170.1470) Blood or tissue constituent monitoring; (170.3880) Medical and biological imaging; (170.5380) Physiology.


Figures

Fig. 1
Fig. 1
Absolute CBF measurements were obtained from a volumetric Doppler OCT data set acquired from the mouse (C57BL/6) neocortex through a thinned-skull cranial window. (A) OCT angiogram showing vasculature and numbered transverse locations of vessels designated for absolute flow measurements. (B) Synthesized Doppler OCT image showing axial velocity profiles (in mm/s) at all designated transverse locations (obtained at different depths). Flux (F) was determined based on the product of the area in the en face plane (Axy) and average axial velocity (vz) over this area for a particular ascending venule numbered 16 (white arrow). (C) Bar graph shows the flow contributions of individual vessels, at the corresponding numbered locations shown in (A) to the total flow over the field of view (ml/100g/min). Absolute flow was calculated from the flux magnitude assuming a cortical thickness of 1.5 mm and a tissue density of 1.05 g/ml [46]. CBF was estimated as the average of the summed arteriolar flow and summed venular flow.
Fig. 2
Fig. 2
Absolute measurements of total intravascular hemoglobin concentration (CHbT) in the mouse (C57BL/6) neocortex through a thinned-skull cranial window. (A) Locations for CHbT measurements. (B) Absolute CHbT values were obtained from the slope of LCHbT versus depth, where LCHbT was obtained by spectroscopic fitting at each depth [40]; the vertical red dotted-lines represent the approximate vessel boundaries. (C) Absolute CHbT measurements at the numbered locations in (A).
Fig. 3
Fig. 3
Imaging of oxygen saturation changes during modulation of FiO2 in the mouse (Crl:SKH1-Hrhr) neocortex through a thinned-skull cranial window. Microvascular oxygen saturation was mapped using visible light spectroscopic OCT and displayed on a false-color scale during (A) 36% FiO2, (B) 16% FiO2. Since arterial and venous oxygen saturation decreased by equal amounts as FiO2 was decreased, oxygen extraction remained approximately constant for this experiment. An artery and vein are labelled as “a” and “v” respectively.
Fig. 4
Fig. 4
Imaging of oxygen saturation changes during modulation of FiCO2 in the mouse (C57BL/6) neocortex through a thinned-skull cranial window. Microvascular oxygen saturation was mapped using visible light spectroscopic OCT and displayed on a false-color scale during (A) 0% FiCO2, (B) 5% FiCO2. A large increase in oxygen saturation was observed in veins, while the sO2 in arteries remained unchanged. The reduced oxygen extraction is a consequence of arterial and arteriolar dilation and subsequently, increased CBF during hypercapnia. Note the heterogeneity of oxygen extraction, as evidenced by regionally varying venous sO2 values both before and after hypercapnia (white and gray arrows). An artery and vein are labeled as “a” and “v” respectively.
Fig. 5
Fig. 5
(A-C) Oxygen extraction (OE), cerebral blood flow (CBF), and hemoglobin concentration (CHbT) were measured in a range of states (achieved by mild modulation of FiO2 and FiCO2) and mice (C57BL/6, N = 3). The OE standard deviation estimate (A) was determined as the square root of the sum of the arterial and venous sO2 variance estimates, obtained from measurements at different locations. The CBF standard deviation estimate (B) was obtained from the summed arteriolar flow and summed venular flow values. (C) The CHbT standard deviation estimate was obtained from measurements at multiple locations. (D) A CMRO2 histogram was generated for each animal and state based on applying Eq. (1) to all possible combinations of arterial saturations (different locations), venous saturations (different locations), CBF values (arteriolar and venular), and CHbT values (different locations). (E) CMRO2 means and standard deviations were estimated from this histogram and shown across states and mice. (F) OE varied inversely with CBF, leading to a lower coefficient of variation for CMRO2 (0.17) as compared with OE (0.70). Error bars in (A-F) are standard deviations.

References

    1. Hall C. N., Klein-Flügge M. C., Howarth C., Attwell D., “Oxidative phosphorylation, not glycolysis, powers presynaptic and postsynaptic mechanisms underlying brain information processing,” J. Neurosci. 32(26), 8940–8951 (2012).10.1523/JNEUROSCI.0026-12.2012 - DOI - PMC - PubMed
    1. Østergaard L., Engedal T. S., Aamand R., Mikkelsen R., Iversen N. K., Anzabi M., Næss-Schmidt E. T., Drasbek K. R., Bay V., Blicher J. U., Tietze A., Mikkelsen I. K., Hansen B., Jespersen S. N., Juul N., Sørensen J. C., Rasmussen M., “Capillary transit time heterogeneity and flow-metabolism coupling after traumatic brain injury,” J. Cereb. Blood Flow Metab. 34(10), 1585–1598 (2014).10.1038/jcbfm.2014.131 - DOI - PMC - PubMed
    1. Iadecola C., “Neurovascular regulation in the normal brain and in Alzheimer’s disease,” Nat. Rev. Neurosci. 5(5), 347–360 (2004).10.1038/nrn1387 - DOI - PubMed
    1. Dirnagl U., Iadecola C., Moskowitz M. A., “Pathobiology of ischaemic stroke: an integrated view,” Trends Neurosci. 22(9), 391–397 (1999).10.1016/S0166-2236(99)01401-0 - DOI - PubMed
    1. Østergaard L., Jespersen S. N., Engedahl T., Gutiérrez Jiménez E., Ashkanian M., Hansen M. B., Eskildsen S., Mouridsen K., “Capillary dysfunction: its detection and causative role in dementias and stroke,” Curr. Neurol. Neurosci. Rep. 15(6), 37 (2015).10.1007/s11910-015-0557-x - DOI - PMC - PubMed

LinkOut - more resources