

Validating a bimodal intravascular ultrasound (IVUS) and near-infrared fluorescence (NIRF) catheter for atherosclerotic plaque detection in rabbits
- PMID: 26504648
- PMCID: PMC4605057
- DOI: 10.1364/BOE.6.003989
Validating a bimodal intravascular ultrasound (IVUS) and near-infrared fluorescence (NIRF) catheter for atherosclerotic plaque detection in rabbits
Abstract
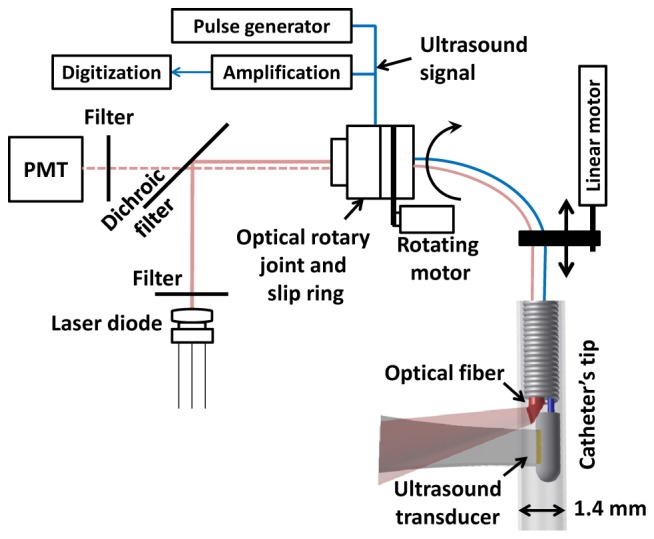
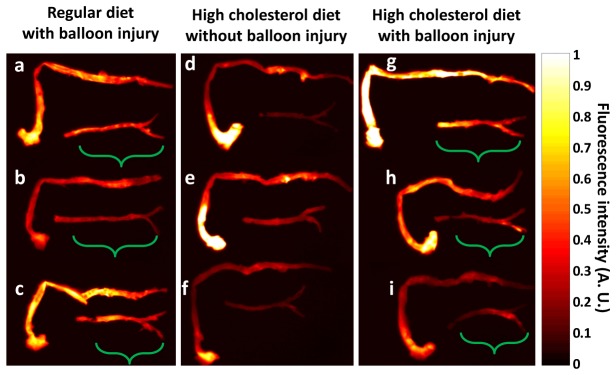
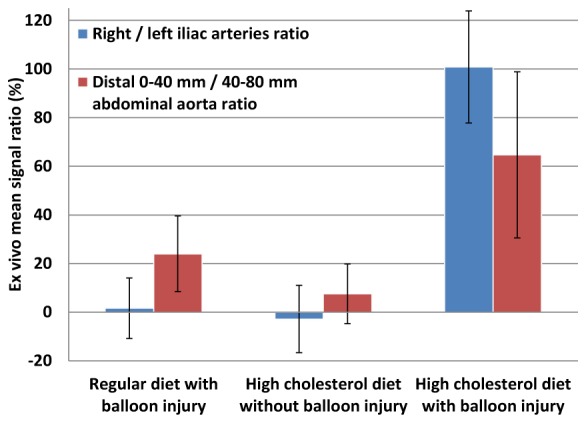
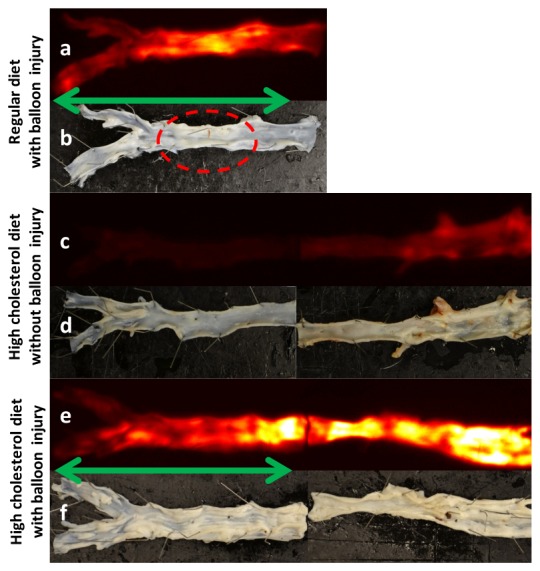
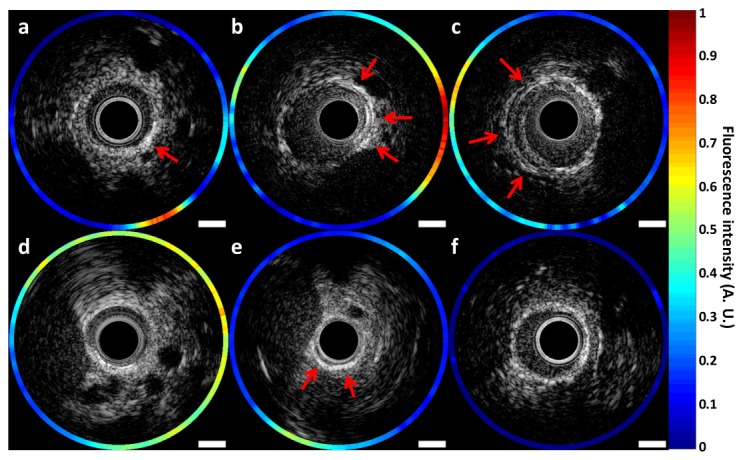
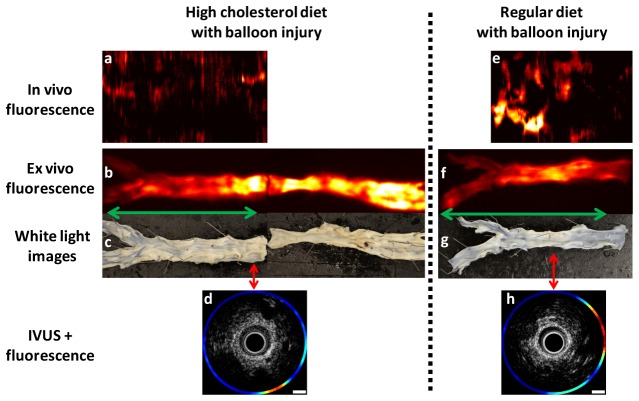
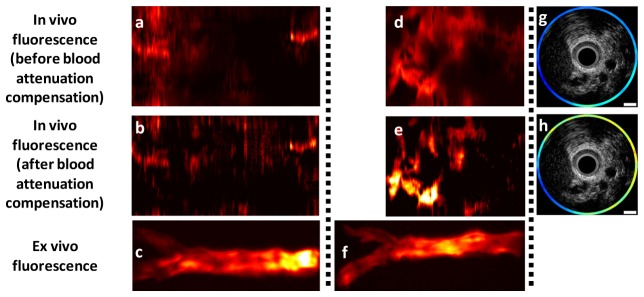
Coronary artery disease is characterized by atherosclerotic plaque formation. Despite impressive advances in intravascular imaging modalities, in vivo molecular plaque characterization remains challenging, and different multimodality imaging systems have been proposed. We validated an engineered bimodal intravascular ultrasound imaging (IVUS) / near-infrared fluorescence (NIRF) imaging catheter in vivo using a balloon injury atherosclerosis rabbit model. Rabbit aortas and right iliac arteries were scanned in vivo after indocyanine green (ICG) injection, and compared to corresponding ex vivo fluorescence and white light images. Areas of ICG accumulation were colocalized with macroscopic atherosclerotic plaque formation. In vivo imaging was performed with the bimodal catheter integrating ICG-induced fluorescence signals into cross-sectional IVUS imaging. In vivo ICG accumulation corresponded to ex vivo fluorescence signal intensity and IVUS identified plaques.
Keywords: (110.7170) Ultrasound; (170.0110) Imaging systems; (170.2150) Endoscopic imaging; (170.6280) Spectroscopy, fluorescence and luminescence.
Figures
Similar articles
-
Fully integrated high-speed intravascular optical coherence tomography/near-infrared fluorescence structural/molecular imaging in vivo using a clinically available near-infrared fluorescence-emitting indocyanine green to detect inflamed lipid-rich atheromata in coronary-sized vessels.Circ Cardiovasc Interv. 2014 Aug;7(4):560-9. doi: 10.1161/CIRCINTERVENTIONS.114.001498. Epub 2014 Jul 29. Circ Cardiovasc Interv. 2014. PMID: 25074255
-
Targeted Near-Infrared Fluorescence Imaging of Atherosclerosis: Clinical and Intracoronary Evaluation of Indocyanine Green.JACC Cardiovasc Imaging. 2016 Sep;9(9):1087-1095. doi: 10.1016/j.jcmg.2016.01.034. Epub 2016 Aug 17. JACC Cardiovasc Imaging. 2016. PMID: 27544892 Free PMC article. Clinical Trial.
-
In vivo near infrared fluorescence (NIRF) intravascular molecular imaging of inflammatory plaque, a multimodal approach to imaging of atherosclerosis.J Vis Exp. 2011 Aug 4;(54):2257. doi: 10.3791/2257. J Vis Exp. 2011. PMID: 21847078 Free PMC article.
-
Intravascular Molecular Imaging: Near-Infrared Fluorescence as a New Frontier.Front Cardiovasc Med. 2020 Nov 23;7:587100. doi: 10.3389/fcvm.2020.587100. eCollection 2020. Front Cardiovasc Med. 2020. PMID: 33330648 Free PMC article. Review.
-
Analysis of contrast-enhanced intravascular ultrasound images for the assessment of coronary plaque neoangiogenesis: another step closer to the identification of the vulnerable plaque.Curr Pharm Des. 2012;18(15):2207-13. doi: 10.2174/138161212800099919. Curr Pharm Des. 2012. PMID: 22352774 Review.
Cited by
-
3-D-Printed Registration Phantom for Combined Ultrasound and Optical Imaging of Biological Tissues.Ultrasound Med Biol. 2020 Jul;46(7):1808-1814. doi: 10.1016/j.ultrasmedbio.2020.03.010. Epub 2020 Apr 25. Ultrasound Med Biol. 2020. PMID: 32340797 Free PMC article.
-
Platform for quantitative multiscale imaging of tissue composition.Biomed Opt Express. 2020 Mar 12;11(4):1927-1946. doi: 10.1364/BOE.383248. eCollection 2020 Apr 1. Biomed Opt Express. 2020. PMID: 32341858 Free PMC article.
-
Mechanisms of delayed indocyanine green fluorescence and applications to clinical disease processes.Surgery. 2024 Aug;176(2):386-395. doi: 10.1016/j.surg.2024.03.053. Epub 2024 May 14. Surgery. 2024. PMID: 38749795 Free PMC article. Review.
-
Intravascular ICG-enhanced NIRF-IVUS imaging to assess progressive atherosclerotic lesions in excised human coronary arteries.NPJ Cardiovasc Health. 2024;1(1):14. doi: 10.1038/s44325-024-00016-8. Epub 2024 Aug 30. NPJ Cardiovasc Health. 2024. PMID: 39246665 Free PMC article.
-
Tumor-Targeting Glycol Chitosan Nanoparticles for Image-Guided Surgery of Rabbit Orthotopic VX2 Lung Cancer.Pharmaceutics. 2020 Jul 3;12(7):621. doi: 10.3390/pharmaceutics12070621. Pharmaceutics. 2020. PMID: 32635231 Free PMC article.
References
-
- Tardif J.-C., Grégoire J., L’Allier P. L., Ibrahim R., Lavoie M.-A., LeMay M., Cohen E., Levesque S., Keller P.-F., Heinonen T., Guertin M.-C., “Effect of atherosclerotic regression on total luminal size of coronary arteries as determined by intravascular ultrasound,” Am. J. Cardiol. 98(1), 23–27 (2006).10.1016/j.amjcard.2006.01.052 - DOI - PubMed
LinkOut - more resources
Full Text Sources
Other Literature Sources