

Update on the Global Burden of Ischemic and Hemorrhagic Stroke in 1990-2013: The GBD 2013 Study
- PMID: 26505981
- PMCID: PMC4633282
- DOI: 10.1159/000441085
Update on the Global Burden of Ischemic and Hemorrhagic Stroke in 1990-2013: The GBD 2013 Study
Abstract
Background: Global stroke epidemiology is changing rapidly. Although age-standardized rates of stroke mortality have decreased worldwide in the past 2 decades, the absolute numbers of people who have a stroke every year, and live with the consequences of stroke or die from their stroke, are increasing. Regular updates on the current level of stroke burden are important for advancing our knowledge on stroke epidemiology and facilitate organization and planning of evidence-based stroke care.
Objectives: This study aims to estimate incidence, prevalence, mortality, disability-adjusted life years (DALYs) and years lived with disability (YLDs) and their trends for ischemic stroke (IS) and hemorrhagic stroke (HS) for 188 countries from 1990 to 2013.
Methodology: Stroke incidence, prevalence, mortality, DALYs and YLDs were estimated using all available data on mortality and stroke incidence, prevalence and excess mortality. Statistical models and country-level covariate data were employed, and all rates were age-standardized to a global population. All estimates were produced with 95% uncertainty intervals (UIs).
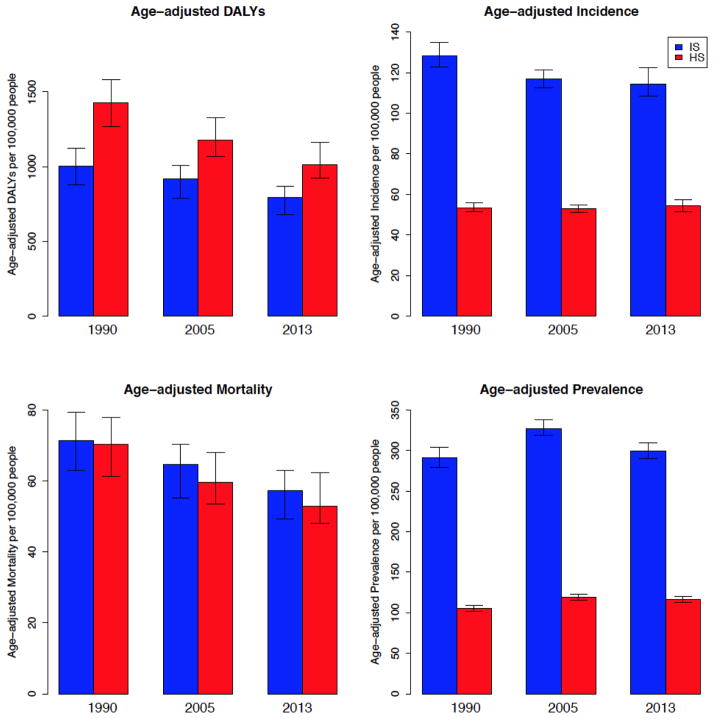
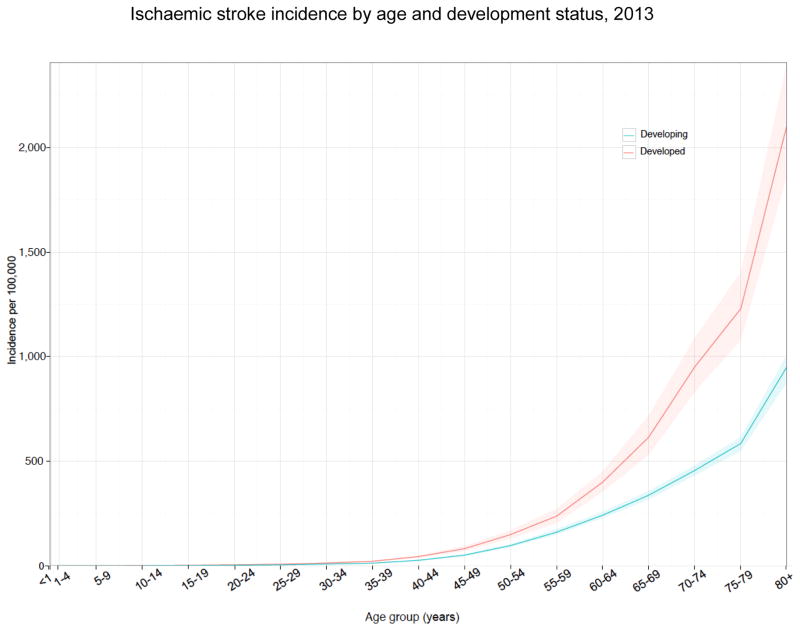
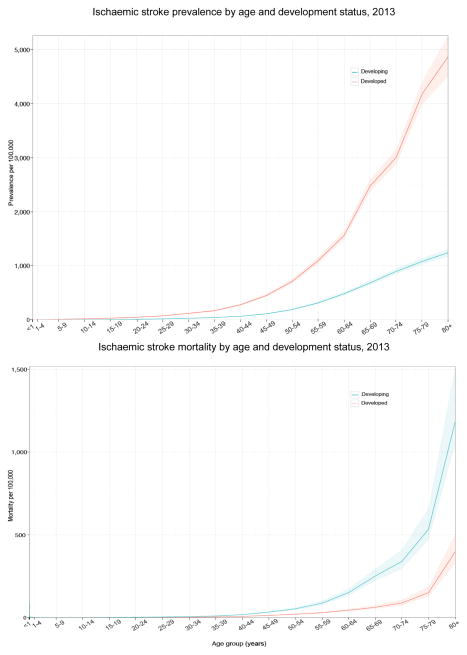
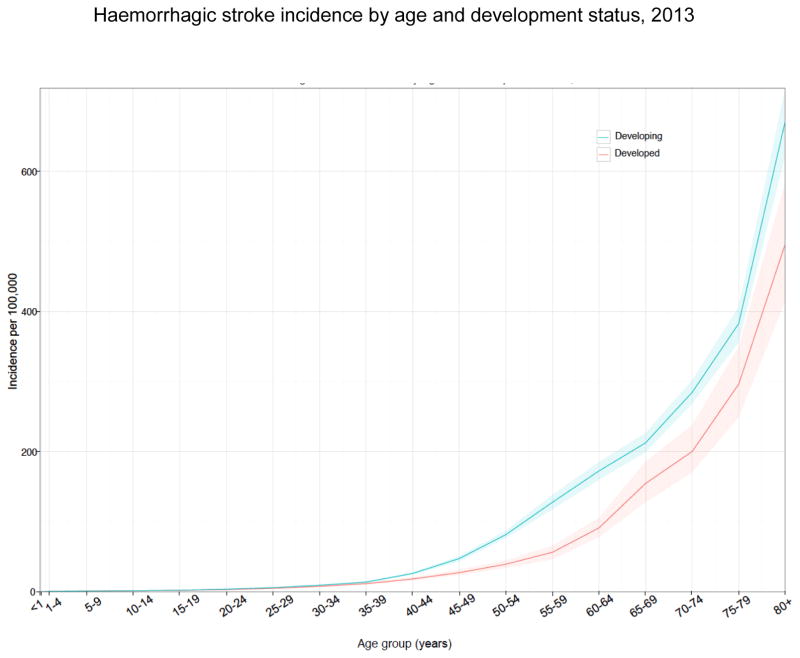
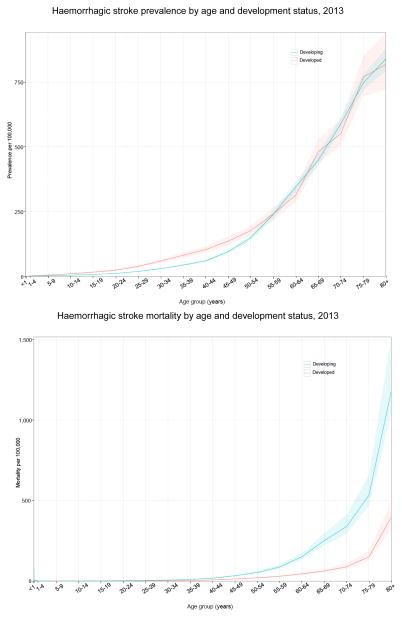
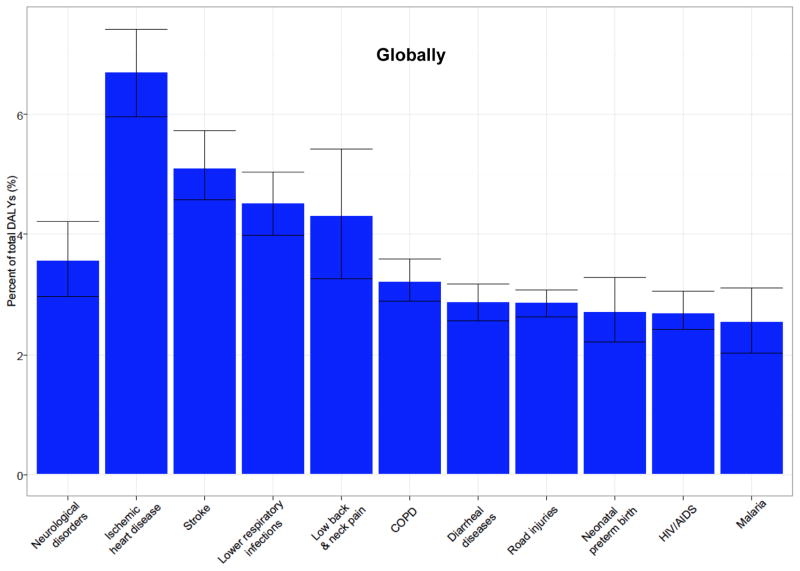
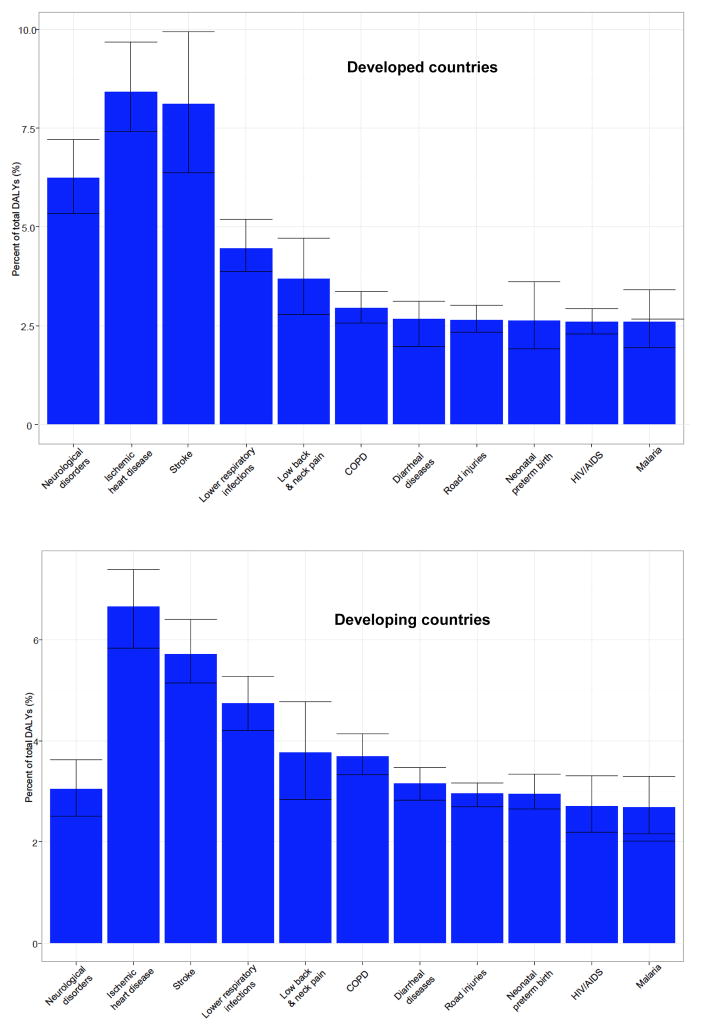
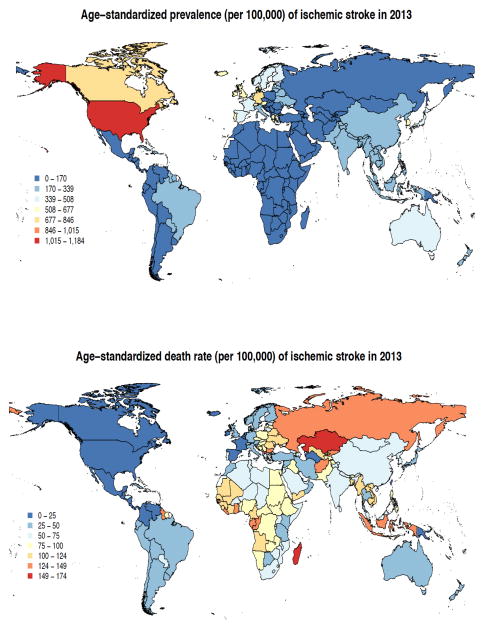
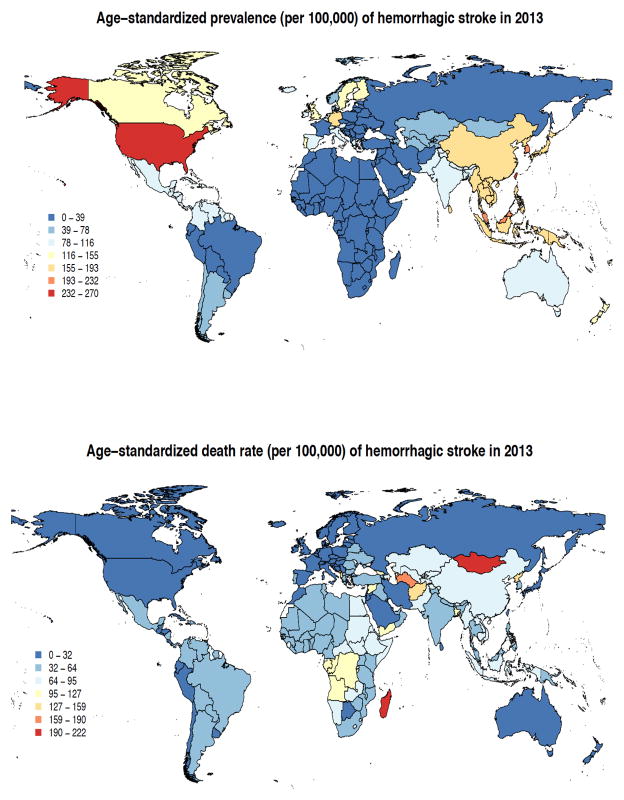
Results: In 2013, there were globally almost 25.7 million stroke survivors (71% with IS), 6.5 million deaths from stroke (51% died from IS), 113 million DALYs due to stroke (58% due to IS) and 10.3 million new strokes (67% IS). Over the 1990-2013 period, there was a significant increase in the absolute number of DALYs due to IS, and of deaths from IS and HS, survivors and incident events for both IS and HS. The preponderance of the burden of stroke continued to reside in developing countries, comprising 75.2% of deaths from stroke and 81.0% of stroke-related DALYs. Globally, the proportional contribution of stroke-related DALYs and deaths due to stroke compared to all diseases increased from 1990 (3.54% (95% UI 3.11-4.00) and 9.66% (95% UI 8.47-10.70), respectively) to 2013 (4.62% (95% UI 4.01-5.30) and 11.75% (95% UI 10.45-13.31), respectively), but there was a diverging trend in developed and developing countries with a significant increase in DALYs and deaths in developing countries, and no measurable change in the proportional contribution of DALYs and deaths from stroke in developed countries.
Conclusion: Global stroke burden continues to increase globally. More efficient stroke prevention and management strategies are urgently needed to halt and eventually reverse the stroke pandemic, while universal access to organized stroke services should be a priority. © 2015 S. Karger AG, Basel.
Conflict of interest statement
All the authors declare that they have no conflict of interest.
Figures
References
-
- Feigin VL, Forouzanfar MH, Krishnamurthi R, Mensah GA, Connor M, Bennett DA, Moran AE, Sacco RL, Anderson L, Truelsen T, O’Donnell M, Venketasubramanian N, Barker-Collo S, Lawes CMM, Wang W, Shinohara Y, Witt E, Ezzati M, Naghavi M, Murray C. Global and regional burden of stroke during 1990–2010: findings from the Global Burden of Disease Study 2010. Lancet. 2014;383:245–254. - PMC - PubMed
-
- Krishnamurthi RV, Feigin VL, Forouzanfar MH, Mensah GA, Connor M, Bennett DA, Moran AE, Sacco RL, Anderson LM, Truelsen T, O’Donnell M, Venketasubramanian N, Barker-Collo S, Lawes CMM, Wang W, Shinohara Y, Witt E, Ezzati M, Naghavi M, Murray C. Global and regional burden of first-ever ischaemic and haemorrhagic stroke during 1990–2010: Findings from the Global Burden of Disease Study 2010. The Lancet Global Health. 2013;1:e259–e281. - PMC - PubMed
-
- An integrative metaregression framework for descriptive epidemiology. University of Washington Press; 2015.
-
- Global, regional, and national incidence, prevalence, and years lived with disability for 301 acute and chronic diseases and injuries in 188 countries, 1990–2013: A systematic analysis for the Global Burden of Disease Study 2013. The Lancet. 2015 doi: 10.1016/S0140-6736(15)60692-4. - DOI - PMC - PubMed
Publication types
MeSH terms
Grants and funding
LinkOut - more resources
Full Text Sources
Other Literature Sources
Medical
Miscellaneous
