. 2016 Jan;79(1):90-109.
doi: 10.1002/ana.24548. Epub 2015 Dec 18.

Melanopsin retinal ganglion cell loss in Alzheimer disease

Affiliations

Melanopsin retinal ganglion cell loss in Alzheimer disease

Chiara La Morgia et al. Ann Neurol. 2016 Jan.

Abstract

Objective: Melanopsin retinal ganglion cells (mRGCs) are photoreceptors driving circadian photoentrainment, and circadian dysfunction characterizes Alzheimer disease (AD). We investigated mRGCs in AD, hypothesizing that they contribute to circadian dysfunction.

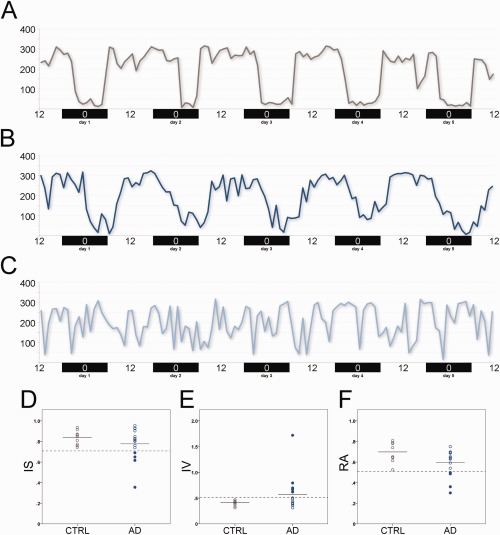
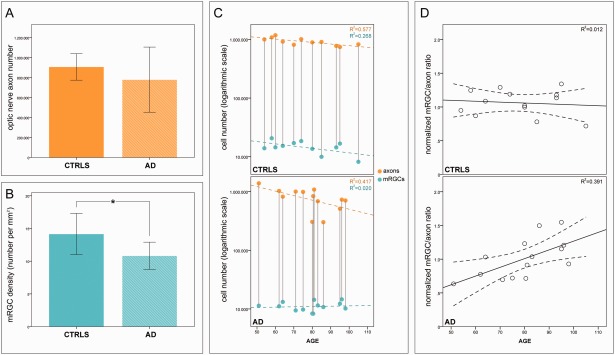
Methods: We assessed retinal nerve fiber layer (RNFL) thickness by optical coherence tomography (OCT) in 21 mild-moderate AD patients, and in a subgroup of 16 we evaluated rest-activity circadian rhythm by actigraphy. We studied postmortem mRGCs by immunohistochemistry in retinas, and axons in optic nerve cross-sections of 14 neuropathologically confirmed AD patients. We coimmunostained for retinal amyloid β (Aβ) deposition and melanopsin to locate mRGCs. All AD cohorts were compared with age-matched controls.

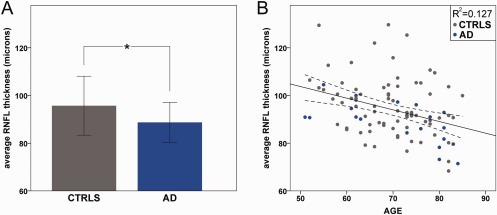
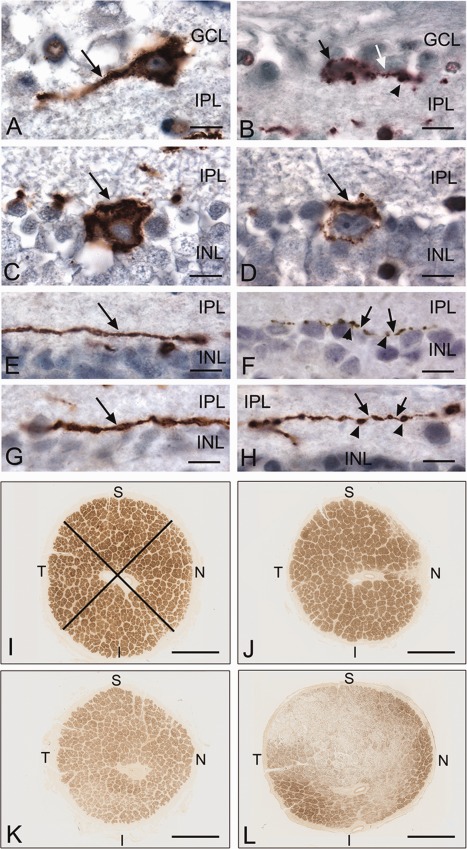
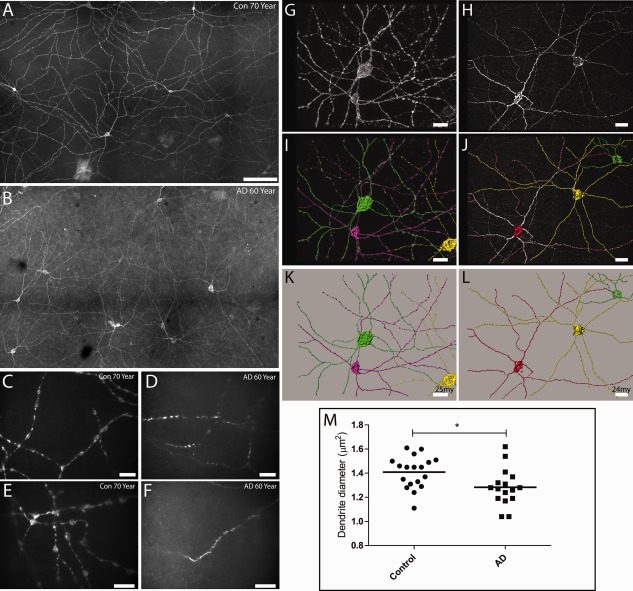
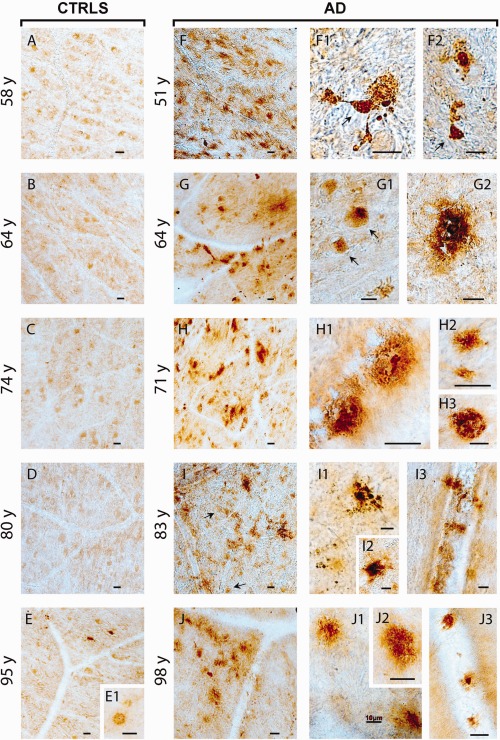
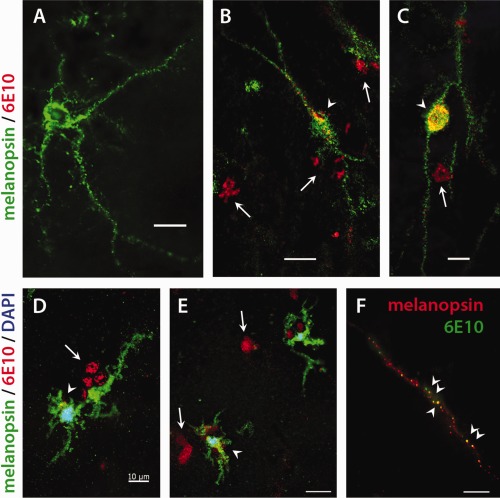
Results: We demonstrated an age-related optic neuropathy in AD by OCT, with a significant reduction of RNFL thickness (p = 0.038), more evident in the superior quadrant (p = 0.006). Axonal loss was confirmed in postmortem AD optic nerves. Abnormal circadian function characterized only a subgroup of AD patients. Sleep efficiency was significantly reduced in AD patients (p = 0.001). We also found a significant loss of mRGCs in postmortem AD retinal specimens (p = 0.003) across all ages and abnormal mRGC dendritic morphology and size (p = 0.003). In flat-mounted AD retinas, Aβ accumulation was remarkably evident inside and around mRGCs.

Interpretation: We show variable degrees of rest-activity circadian dysfunction in AD patients. We also demonstrate age-related loss of optic nerve axons and specifically mRGC loss and pathology in postmortem AD retinal specimens, associated with Aβ deposition. These results all support the concept that mRGC degeneration is a contributor to circadian rhythm dysfunction in AD.


Figures

Figure 1
Figure 1
Optical coherence tomography results in controls (CTRLS) and Alzheimer disease (AD) patients. (A) Average retinal nerve fiber layer (RNFL) thickness results are reported for CTRLS and AD patients (*significant difference, p = 0.038). (B) Correlations between average RNFL thickness and age in years is reported (p < 0.001, R 2 = 0.127).
Figure 2
Figure 2
Actigraphic results in controls and Alzheimer disease (AD) patients. (A–C) Examples of actigraphic profiles are shown for a control (A), an AD patient with a profile resembling a control (B), and an AD patient with a severe disruption of the rest–activity circadian rhythm (C). (D–F) Scatter plots of (D) interdaily stability (IS), (E) intradaily variability (IV), and (F) relative amplitude (RA) for controls (gray circles) and AD patients (blue circles) are provided. Filled blue circles represent individual AD patients with values >2 standard deviations from the mean of controls (“circadian‐impaired” individuals).
Figure 3
Figure 3
Melanopsin retinal ganglion cells, their dendrites, and optic nerve cross‐sections from controls and Alzheimer disease (AD) patients. Light micrographs of paraffin‐embedded retinas, immunoperoxidase stained for melanopsin with diaminobenzidine (brown color; A–H), and plastic‐embedded optic nerve cross‐sectional profiles, stained with paraphenylenediamine (brown color) for myelin (I–L). (A) Control retina with a single melanopsin retinal ganglion cell (mRGC) in the ganglion cell layer (GCL). Note homogeneous staining of cell body and dendrite (arrow). (B) AD retina with a single mRGC in the GCL. Note patchy staining of melanopsin in the cell body (black arrow). A single dendrite can be seen with a focal attenuation (white arrow) and varicosity (arrowhead). (C) Control retina with a single mRGC in the inner nuclear layer (INL). Note homogeneous staining of the cell body (arrow). (D) AD retina with a single mRGC in the INL. Note patchy staining of melanopsin (arrow). (E, G) Control retinas with a single immunostained dendrite (arrow) for melanopsin. Note caliber thickness. (F, H) AD retinas with a single immunostained dendrite for melanopsin. Note thinning or focal attenuations (arrows) of dendrites between varicosities (arrowheads). (I) Control optic nerve (1.18 million axons) with normal staining of axon bundles. The crossed lines delineate an example of sectorial sampling in quadrants for axon counting. (J–L) Examples of AD optic nerves with mild (J; A3, 822,000 axons), moderate (K; A14, 706,000 axons), and severe (L; A6, 306,000 axons) axonal depletion. I = inferior; INL = inner nuclear layer; IPL = inner plexiform layer; N = nasal; S = superior; T = temporal. Scale bars: A–H, 10 µm; I–L, 1mm.
Figure 4
Figure 4
Melanopsin retinal ganglion cell (mRGC) density and axon number in controls and Alzheimer disease (AD) patients. (A) Mean and standard deviation of axon counts in controls and AD. (B) Mean and standard deviation of mRGC density in controls and AD patients (*significant difference, p = 0.003). (C) Correlation of axon count with age in years in controls (p = 0.001, R 2 = 0.577; orange circles, upper panel), correlation of mRGC number with age in years in controls (p = 0.035, R 2 = 0.268; cyan circles, upper panel), correlation of axon count with age in years in AD (p = 0.006, R 2 = 0.417; orange circles, lower panel), and correlation of mRGC number with age in years in AD (p = 0.313, R 2 = 0.020; cyan circles, lower panel). (D) Correlations between the standardized mRGC/RGC ratio and age in years are shown for controls (R 2 = 0.012; upper panel) and AD (R 2 = 0.391; lower panel).
Figure 5
Figure 5
Flat‐mounted retinas and dendritic process analysis in Alzheimer disease (AD) patients and controls (Con). (A–F) Melanopsin immunoreactivity in control retinas (A, C, E) and in AD patients (B, D, F). At low magnification, melanopsin staining is present in a subpopulation of ganglion cells and displaced ganglion cells forming a dendritic network. The dendritic network of melanopsin processes in control retinas is characterized by long processes with a large “boutons en passant” (A, C, E). In contrast, melanopsin retinal ganglion cells (mRGCs) in AD patients have an abnormal morphology in which dendritic processes have a smaller diameter with a lack of “boutons en passant” (B, D, F). (G–L) Morphological analysis of control (G, I, K) and AD mRGCs (H, J, L). Stacks of images of mRGCs were generated, and a 3‐dimensional reconstruction was performed (see Subjects and Methods), followed by analysis of the processes using the filament trace module in Imaris (Bitplane). In G, I, and K, 3 cells from a control (green, purple, and yellow) and their dendritic processes are visualized. (G) The raw picture after deconvolution and (I) after tracing of the processes are shown. (K) Only the traced cells identified by the program are shown. Similarly, in H, J, and L, 3 mRGCs from AD an patient are shown. (M) The results of the total analysis of 18 cells from 3 controls (C3: 60 years old, 6 cells; C5: 70 years old, 8 cells; C12: 95 years old, 4 cells) and 16 cells from 4 AD patients (A1: 51 years old, 5 cells; A2: 62 years old, 5 cells; A6: 80 years old, 3 cells; A13: 96 years old, 3 cells) are shown, demonstrating a significant reduction of dendrite diameter in AD patients (*p = 0.003). Scale bars: A, B, 100 µm; C, D, 50 µm; E, F, 20 µm; G, I, K, 25 µm; H, J, L, 24 µm.
Figure 6
Figure 6
Amyloid‐β (Aβ) deposition in the superior retinas of Alzheimer disease (AD) patients. Examination of Aβ immunoreactivity in flat‐mounted retinas from 5 definite AD cases (range = 51–98 years; A1: 51 years; A3: 64 years; A4: 71 years; A9: 83 years; A14: 98 years) and age‐/gender‐matched controls (range = 58–95 years; C2: 58 years; C4: 64 years; C6: 74 years; C8: 80 years; C12: 95 years) using anti‐human Aβ monoclonal antibodies and standard peroxidase‐based techniques is shown. (A–J) Representative micrographs from corresponding superior temporal quadrant locations in the retina exhibit no to minimal Aβ immunoreactivity in healthy control retinas (A–E) and substantial Aβ burden in AD retinas (F–J; dark brown). Retinal Aβ plaques in AD patients are frequently found in clusters (F–J, left). Higher‐magnification images demonstrate variable morphology of extracellular Aβ depositions (F1–J3), including immature plaques (H2, I3, J1, J2), classical mature plaques with central dense Aβ core and radiating fibrillar arms (F2, G2, H1, I2, J3), and compact plaques composed of multiple dense cores (H3, I1). Diffuse plaques are typically found in postmortem retinas of AD patients (I3) but can occasionally be detected in aged healthy control retina (E1). Intracellular Aβ immunoreactivity is indicated with black arrows (F1, F2, G1, I). Furthermore, retinal Aβ deposits are also detected along blood vessels (I3, J3; blood vessel structures can be seen as transparent–lighter lane or tube shapes containing erythrocytes). Scale bars = 20 µm unless otherwise indicated.
Figure 7
Figure 7
Colocalization of amyloid‐β (Aβ) deposition and melanopsin retinal ganglion cells (mRGCs) in flat‐mounted retinas of Alzheimer disease (AD) patients. (A–F) Fluorescent immunohistochemistry analysis of flat‐mounted retinas isolated from AD patients (n = 5; A1: 51 years; A3: 64 years; A4: 71 years; A9: 83 years; A14: 98 years) and age‐matched controls (n = 5; C2: 58 years; C4: 64 years; C6: 74 years; C8: 80 years; C12: 95 years) in different age groups (range = 51–98 years) colabeled with anti‐Aβ (6E10) and antimelanopsin antibodies. (A) Representative micrograph from control individual demonstrates an intact melanopsin‐containing RGC having long dendrites without presence of Aβ. (B, C) Representative micrographs from AD patients demonstrating intracellular Aβ deposition in mRGCs (arrowheads) as well as extracellular Aβ (arrows). (D, E) The mRGCs exhibited fewer cell processes. Abnormal morphology was frequently found in AD patients; mRGCs showed loss of dendritic arborization in the presence of intra‐ and extracellular Aβ. (F) An example of an mRGC neurite from AD retina showing colocalization with Aβ (arrowheads). Scale bars = 20 µm unless otherwise indicated. DAPI = 4′,6‐diamidino‐2‐phenylindole.

References

    1. Querfurth HW, LaFerla FM. Alzheimer's disease. N Engl J Med 2010;362:329–344. - PubMed
    1. Wu YH, Swaab DF. Disturbance and strategies for reactivation of the circadian rhythm system in aging and Alzheimer's disease. Sleep Med 2007;8:623–636. - PubMed
    1. Hatfield CF, Herbert J, van Someren EJ, et al. Disrupted daily activity/rest cycles in relation to daily cortisol rhythms of home‐dwelling patients with early Alzheimer's dementia. Brain 2004;127:1061–1074. - PubMed
    1. Dowling GA, Burr RL, Van Someren EJ, et al. Melatonin and bright‐light treatment for rest‐activity disruption in institutionalized patients with Alzheimer's disease. J Am Geriatr Soc 2008;56:239–246. - PMC - PubMed
    1. Swaab DF, Fliers E, Partiman TS. The suprachiasmatic nucleus of the human brain in relation to sex, age and senile dementia. Brain Res 1985;342:37–44. - PubMed

Publication types