. 2015 Oct 27:6:8220.
doi: 10.1038/ncomms9220.

Large-scale climatic anomalies affect marine predator foraging behaviour and demography

Affiliations

Large-scale climatic anomalies affect marine predator foraging behaviour and demography

Charles A Bost et al. Nat Commun. .

Abstract

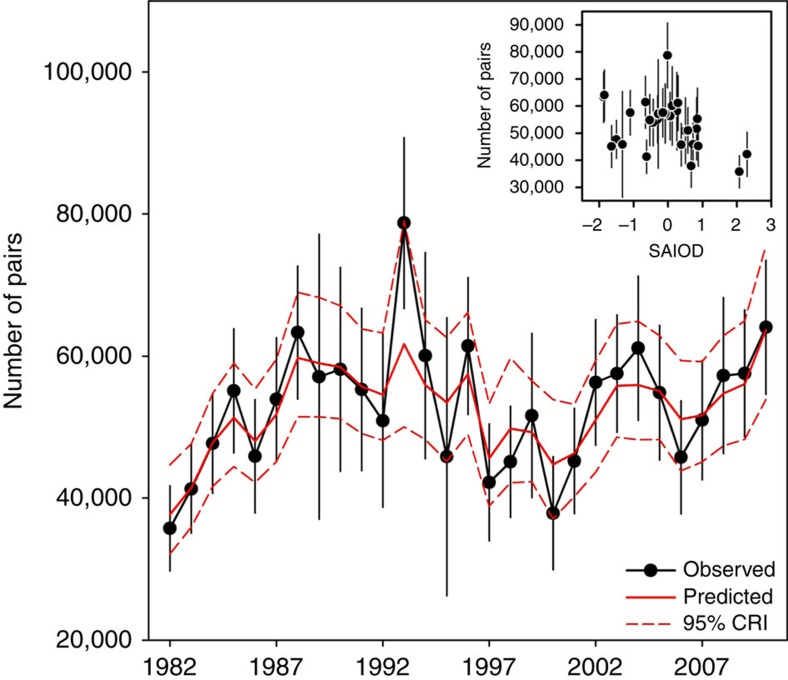
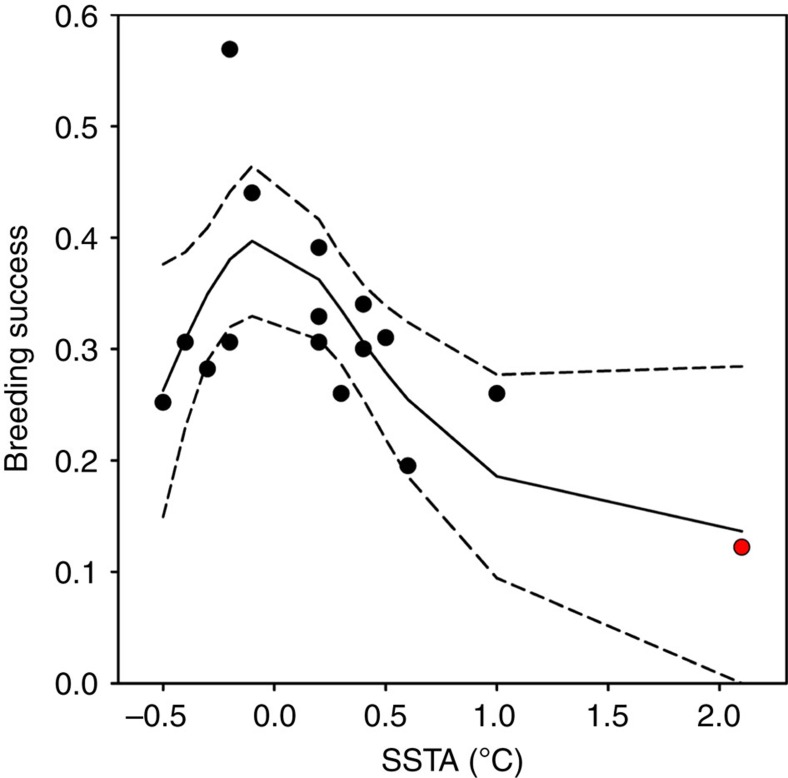
Determining the links between the behavioural and population responses of wild species to environmental variations is critical for understanding the impact of climate variability on ecosystems. Using long-term data sets, we show how large-scale climatic anomalies in the Southern Hemisphere affect the foraging behaviour and population dynamics of a key marine predator, the king penguin. When large-scale subtropical dipole events occur simultaneously in both subtropical Southern Indian and Atlantic Oceans, they generate tropical anomalies that shift the foraging zone southward. Consequently the distances that penguins foraged from the colony and their feeding depths increased and the population size decreased. This represents an example of a robust and fast impact of large-scale climatic anomalies affecting a marine predator through changes in its at-sea behaviour and demography, despite lack of information on prey availability. Our results highlight a possible behavioural mechanism through which climate variability may affect population processes.


Figures

Figure 1
Figure 1. Foraging distribution of penguins and their relationship with large-scale climatic anomalies.
(a) Map of the Crozet sector, South Indian ocean. The white lines show the main frontal structures. (b) Satellite-tracks of at-sea king penguins from the Crozet Islands monitored over a 16-year period (1992–2010). The tracks are shown with the corresponding locations of the Antarctic PF (green lines; upper line: 5 °C sea surface isotherm; bottom: 4 °C sea surface isotherm). The orange dots show the position of the study colony (Baie du Marin, Possession Island, Crozet). The red box displays the exceptional situation during the summer 1997 with the extension of the penguins' foraging ranges in relation to the southward shift of the PF. (c) Time series of latitudinal PF location anomaly and of the leading mode from the PCA of SST anomalies over a combined South Atlantic-Indian domain (10°–50°S, 50°W–150°E). See Fig. 3 for the associated SST spatial pattern. This leading PCA mode (standardized time series, red curve) of February–March SST anomalies described 27% of the SST variability over the combined domain during the 1979–2011 period and will be referred to as the South Atlantic and Indian Oceans dipole (SAIOD) time series. The anomaly of the PF zonal position (PFA, positive=south, negative=north, in degree, blue curve) concerns the latitude estimated for the sector between 50/54°E. SAF: Sub-Antarctic front; STF: subtropical front; PF: polar front.
Figure 2
Figure 2. Relationships between penguins foraging behaviour and conditions at the Polar Front in summer, South Indian Ocean (Crozet sector).
Error bars are s.e.m. and the solid black line are regression slopes based on the data. (a) Mean maximal foraging range of penguins as a function of inter-annual variations in the PF location (1992–2007, n=14 years). (b) Mean maximal foraging depth as a function of inter-annual variations in the thermocline depth in the polar frontal zone (1995–2004, n=7 years).
Figure 3
Figure 3. Spatial pattern associated with the Subtropical Atlantic and Indian Oceans dipole (SAIOD) time series (that is, the leading mode of the principal component analysis (PCA) of February–March SST anomaly fields over the combined South Atlantic–Indian domain).
Figure 4
Figure 4. Observed and modelled changes in the king penguin breeding population at Possession Island (Crozet) from 1982 to 2010.
The modelled changes were obtained from a stochastic Gompertz model with density dependence and an effect of the Subtropical Atlantic and Indian Oceans dipole (SAIOD) time series. The inset shows the observed breeding population size as a function of SAIOD. Error bars are s.e.m.
Figure 5
Figure 5. Fitted GAM results showing the relationship between the king penguin breeding success data and sea surface temperature anomalies (SSTA) in their main foraging area at the PF for the period 1987–2010.
Dotted lines indicate 95% confidence intervals. The red dot indicate the year 1997.

Comment in

  • Ecology: Foraging further.
    Gardiner JR. Gardiner JR. Nature. 2015 Oct 29;526(7575):646. doi: 10.1038/526646a. Nature. 2015. PMID: 26511576 No abstract available.

References

    1. Hughes L. Biological consequences of global warming: is the signal already apparent? Trends Ecol. Evol. 15, 56–61 (2000). - PubMed
    1. Parmesan C. Ecological and evolutionary responses to recent climate change. Annu. Rev. Ecol. Evol. Syst. 37, 637–669 (2006).
    1. Walther G. R. et al.. Ecological responses to recent climate change. Nature 416, 389–395 (2002). - PubMed
    1. Hunt G. L. Jr et al.. Climate impacts on eastern Bering Sea food webs: a synthesis of new data and an assessment of the Oscillating Control Hypothesis. ICES J. Mar. Sci 68, 1230–1243 (2011).
    1. Baier C. T. & Napp J. M. Climate-induced variability in Calanus marshallae populations. J. Plankton Res 25, 771–782 (2003).

Publication types

LinkOut - more resources