Observational Study
. 2015 Oct 21;7(10):5443-75.
doi: 10.3390/v7102881.

Longitudinal Antigenic Sequences and Sites from Intra-Host Evolution (LASSIE) Identifies Immune-Selected HIV Variants

Affiliations
Observational Study

Longitudinal Antigenic Sequences and Sites from Intra-Host Evolution (LASSIE) Identifies Immune-Selected HIV Variants

Peter Hraber et al. Viruses. .

Abstract

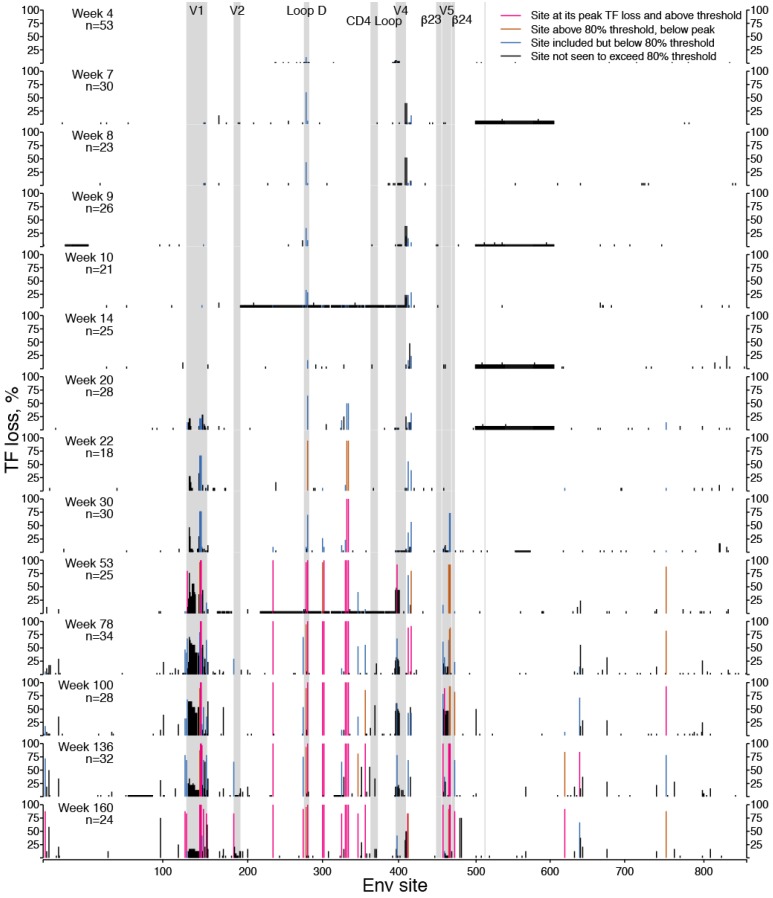
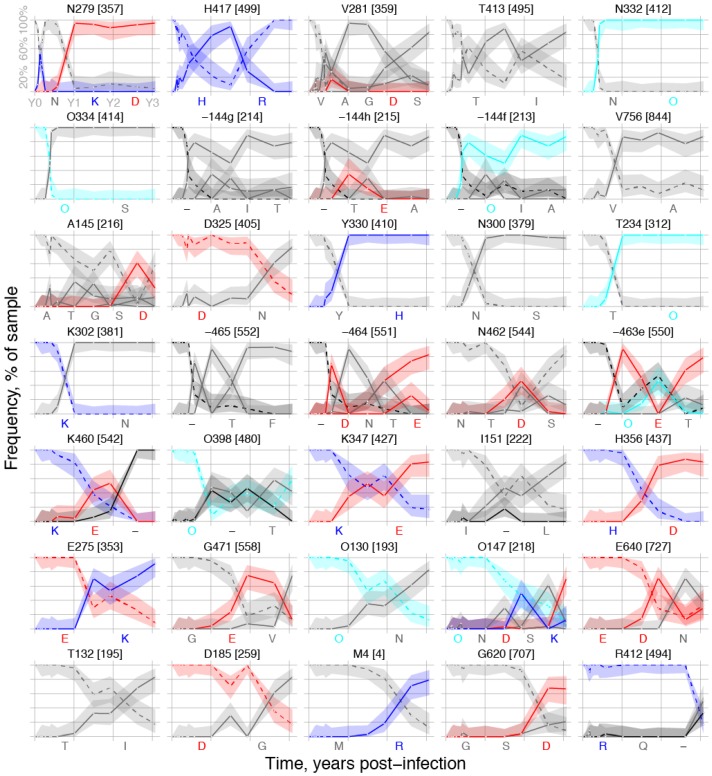
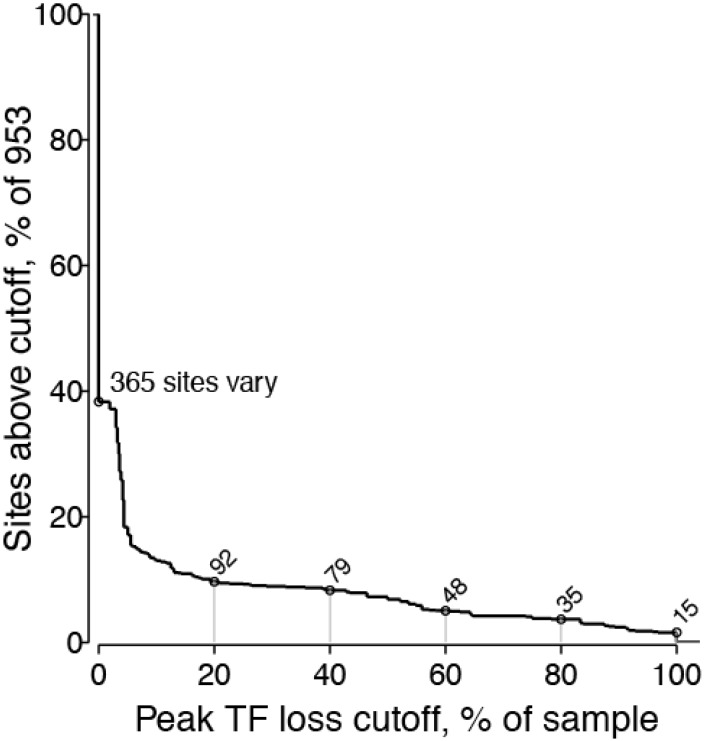
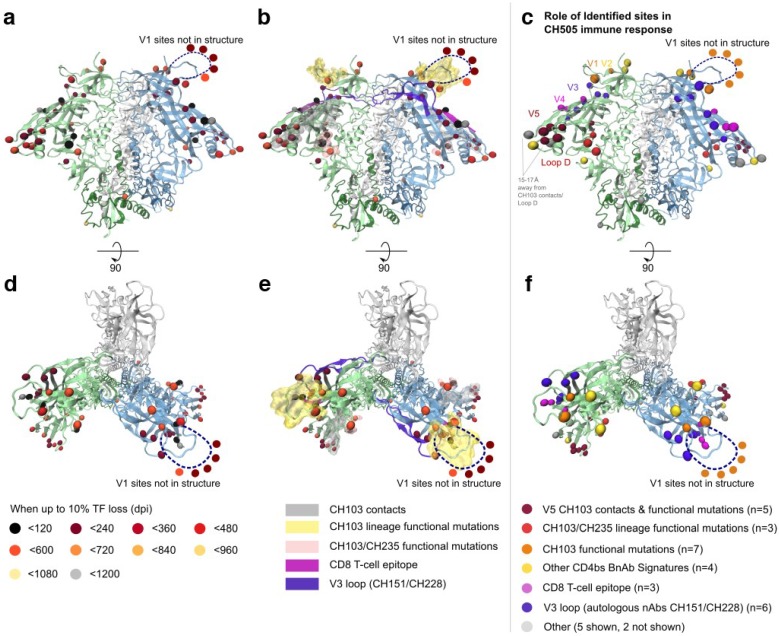
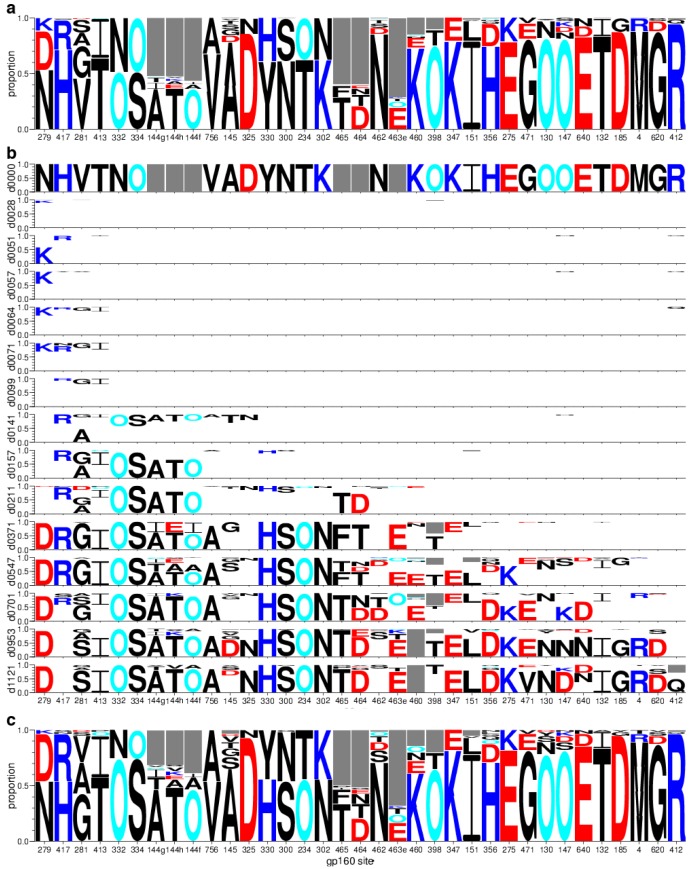
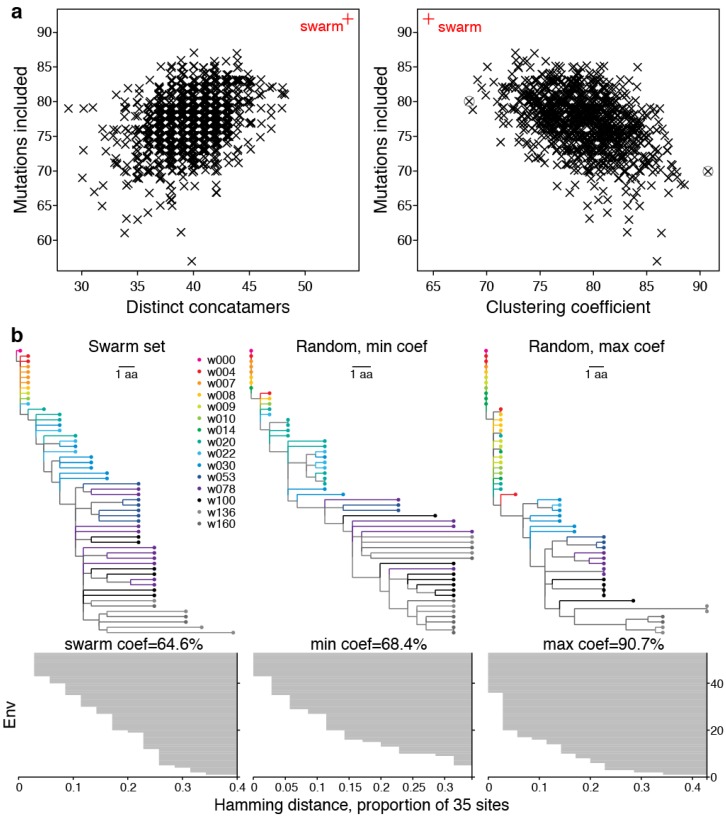
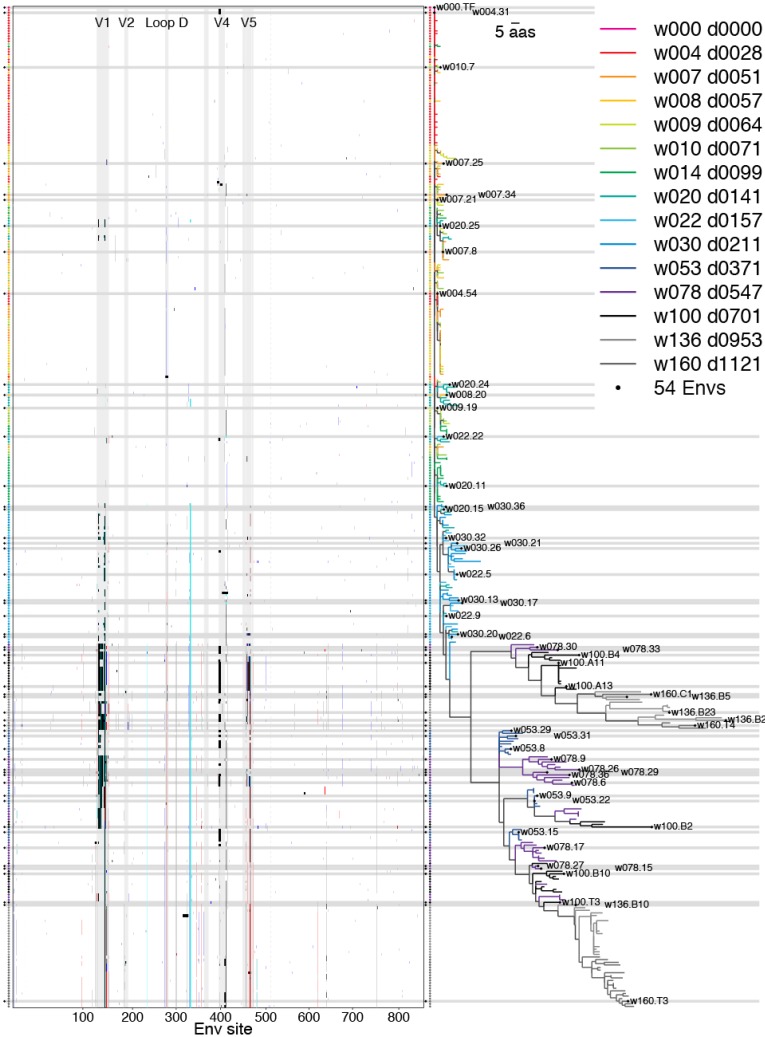
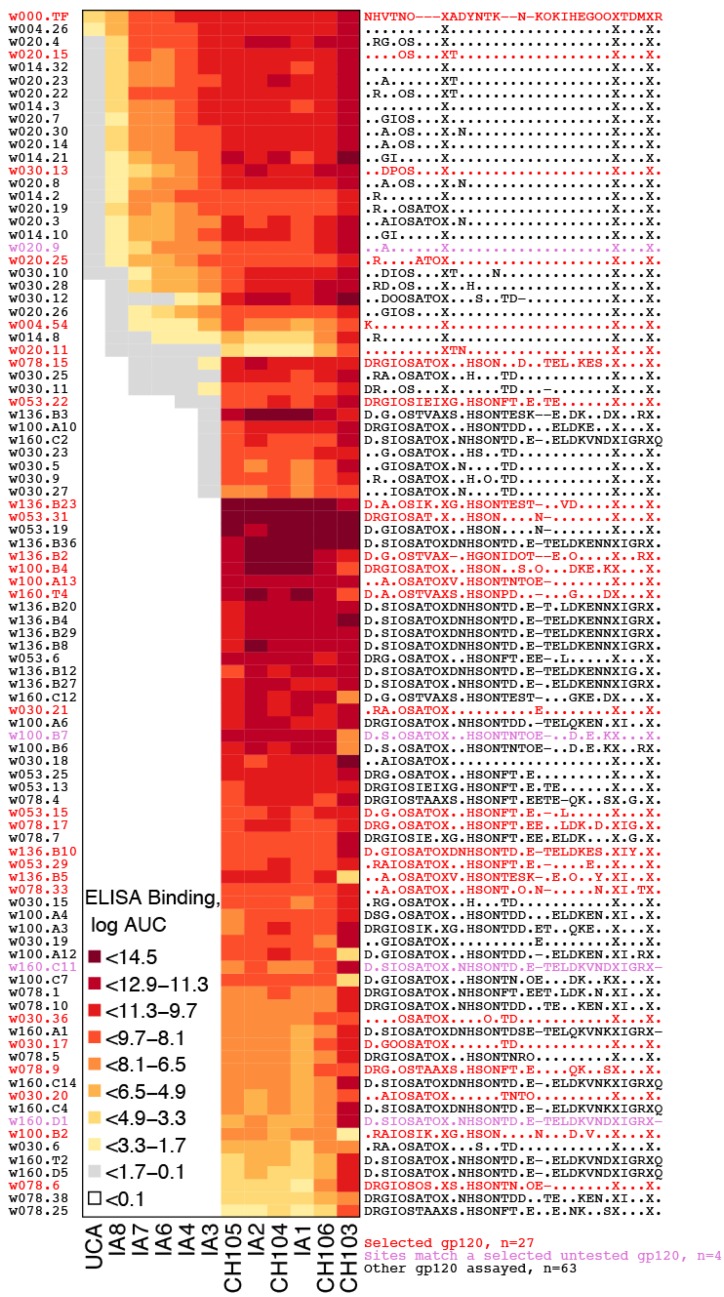
Within-host genetic sequencing from samples collected over time provides a dynamic view of how viruses evade host immunity. Immune-driven mutations might stimulate neutralization breadth by selecting antibodies adapted to cycles of immune escape that generate within-subject epitope diversity. Comprehensive identification of immune-escape mutations is experimentally and computationally challenging. With current technology, many more viral sequences can readily be obtained than can be tested for binding and neutralization, making down-selection necessary. Typically, this is done manually, by picking variants that represent different time-points and branches on a phylogenetic tree. Such strategies are likely to miss many relevant mutations and combinations of mutations, and to be redundant for other mutations. Longitudinal Antigenic Sequences and Sites from Intrahost Evolution (LASSIE) uses transmitted founder loss to identify virus "hot-spots" under putative immune selection and chooses sequences that represent recurrent mutations in selected sites. LASSIE favors earliest sequences in which mutations arise. With well-characterized longitudinal Env sequences, we confirmed selected sites were concentrated in antibody contacts and selected sequences represented diverse antigenic phenotypes. Practical applications include rapidly identifying immune targets under selective pressure within a subject, selecting minimal sets of reagents for immunological assays that characterize evolving antibody responses, and for immunogens in polyvalent "cocktail" vaccines.

Keywords: antigenic swarm; coevolution; envelope glycoprotein; human immunodeficiency virus type 1; immune escape; immunogen design; neutralizing antibodies; quasispecies; selection; vaccine.


Figures

Figure 1
Figure 1
Loss of ancestral transmitted-founder (TF) amino acids in Envs from CH505. For 953 aligned Env sites spanning the full-length protein, TF loss is proportion of non-TF mutations per time-point sampled from the study participant CH505. TF loss is computed for each of 14 time-points sampled longitudinally, weeks 4 through 160, with the number of Envs sequenced (n) per time-point as shown. Bar colors vary over time to indicate 35 sites with at least 80% TF loss in any time-point, whether at peak TF loss (pink), below peak but above the 80% cutoff (brown), or below 80% (blue). Variable sites that were not selected for further consideration, because they never exceeded 80% TF loss in ant time-point during the study period, are also depicted (black bars). Grey boxes identify variable loops, which contain hypervariable regions that evolve by insertion and deletion, and other gp120 landmarks. A thin grey line marks the boundary between gp120 and gp41. The time of the sample is shown as weeks post infection. Env site numbers indicate HXB2 positions in the CH505 protein alignment, beginning with the signal peptide start codon in column one and ending with the stop codon at position 857.
Figure 2
Figure 2
Variant frequency dynamics within sites. The single TF virus amino acid (dashed lines with 100% initial frequency) yields to putative escape mutations (solid lines with 0% initial frequency) over the sampling period. Letters below each plot list mutations in order of appearance, with panels ordered by timing of TF loss. Numbers above each plot denote TF form, HXB2 position, and alignment column, e.g., “N279 [357] indicates loss of the transmitted asparagine at HXB2 position 279, alignment column 357. Lower-case letters denote insertions at the C-terminal end of the HXB2 site given. Colors indicate positive (blue) and negative (red) charges and an “O” is used instead of “N” to indicate a potentially glycosylated asparagine (cyan), i.e., an N that is embedded in a glycosylation motif of Nx[ST], where x can be any amino acid except Pro, followed by either Ser or Thr. Vertical bars indicate the sampling year, abbreviated in the upper left panel as Y0, Y1 and Y2, with a single TF virus starting at Y0, then followed by the first time-point sampled, estimated to be 28 days post infection for CH505 [15]. Shaded regions show 95% confidence intervals for variant frequencies, computed from the binomial probability distribution, given the number of sequences sampled per time-point. Several distinct insertions arise after HXB2 position 144 in the V1 loop, shown in panels in the middle of the second row as 144f, 144g, and 144h. Lower-case letters (f through h) specify the relative positions of the inserted region in the alignment [45]. The TF lacks an amino acid in this position, which is characterized as a gapped state and represented by a dash (–) to maintain the alignment. Over time, new and distinct insertions arise that span this position, with major and minor variants carried along with distinctive insertions occurring at positions 144f, 144g, and 144h (e.g., in 144 g, three different insertions are maintained, which include A, I and T).
Figure 3
Figure 3
Cumulative distribution of peak TF loss over 953 aligned Env sites. Peak TF loss is the greatest proportion of non-TF variants in any time-point sampled, which corresponds to the minimum for each dashed line in Figure 2. Of 953 aligned sites, 365 (38.3%) varied and the others did not vary among sequences sampled throughout the period studied. We selected 35 sites with at least 80% peak TF loss for further study. Other cutoff values would yield more (e.g., 48 at 60% TF loss) or fewer sites (e.g., 15 at 100% loss) for consideration.
Figure 4
Figure 4
Selected sites are localized to the known immunogenic regions in CH505, as visualized by mapping onto the structure of the engineered BG505 SOSIP trimer (Protein Data Bank ID 4TVP [48]). Selected sites are depicted as spheres, colored to indicate the timing of their emergence. (a) Side view, oriented with viral membrane towards bottom; (b) Additional colored highlights indicate known immunogenic regions; (c) Selected sites are colored to show which immune pressures are known to have induced TF loss; (df) The corresponding details from top view, as seen from host cell membrane. Table 1 lists symbol colors for each selected site.
Figure 5
Figure 5
Variant frequency across 35 sites selected from CH505 Env gp160. (a) Population variant frequencies, computed from 385 aligned, full-length protein sequences; (b) Temporal development of variant frequencies. To emphasize TF loss progression, frequency of the TF form below the first row is blank. Each row corresponds to one time-point sampled for the three-year study period, days 0–1121 (d0000 through d1121); (c) Variant frequencies in swarm set of 54 selected Envs. Symbol height is proportional to amino acid frequency per site. Colors correspond to Figure 2. The gaps inserted to maintain the alignment appear as grey boxes to represent indels. Site order follows ranks listed in Table 1. This visualization was produced from modified sequence logos by the lassie package; see Section 4.4 for availability.
Figure 6
Figure 6
The selected swarm set is distinct from randomly selected sets. (a) Number of distinct concatamers, mutations included, and clustering coefficients from dendrograms of concatamer distances differ for the selected swarm of 54 Envs (red) and the null distribution from 1000 sets of 54 Envs, randomly selected without replacement from the non-redundant set of 260 viable full-length Envs, with the TF form always included. Values have jitter added for less overplotting; (b) Clustering coefficient quantifies sequence differences as the average normalized distance at which each sequence is merged into a cluster (horizontal grey bars in bottom row), compared for the selected swarm set two extreme randomly sampled sets (min and max, circled points in a, right).
Figure 7
Figure 7
Env variants in phylogenetic context. A pixel plot is paired with the maximum-likelihood phylogeny, such that each row depicts one of 385 Envs sequenced by limiting-dilution PCR. The top row corresponds to the TF virus. In the pixel plot (left), sites that match the TF are blank and mutations are shaded indicate gain of negatively (red) or positively charged amino acids (blue), addition of an N-linked glycosylation motif (cyan), indels (black), or other mutations (grey). The colored vertical stripes that emerge with time correspond roughly to TF loss. Env landmarks appear as vertical bands throughout the pixel plot (light grey), and dashed line delineates the boundary between gp120 and gp41. Tree branches and symbols are color-coded to indicate sample time-point, and the 54 selected Envs are marked by a black circle and horizontal bar. HXB2 numbering is used here and throughout, beginning with the Env signal peptide start codon in column one and ending with the stop codon at position 857. This visualization was produced by the pixelgram package; see Section 4.4 for availability.
Figure 8
Figure 8
Selected Envs represent diverse binding phenotypes. Among the swarm of 54 Envs selected, 27 were synthesized as gp120s for ELISA binding assays (red text). Another four of the antigens tested contained selected sites that matched with those in selected Envs (purple text). Binding data are shown as colors to indicate log-transformed area under the curve (AUC) from dilution series, which summarized experimental results better than EC50s. Both assays tested Env constructs against monoclonal antibodies of the CH103 lineage, from mAb isolates (e.g., CH103) to the unmutated ancestor (UCA) via intermediate ancestors IA1–IA8 [15]. Blank entries indicate no binding was detected. Selected Env sites correspond to concatamers in Table S3. An “X” appears for gp41 sites, which were not in the gp120 antigens tested. Data are listed in Table S4.
Figure 9
Figure 9
Swarm-selection algorithm. From a protein sequence alignment and list of selected sites, this approach identifies viable Envs and tabulates mutations in selected sites. The table initially defines which mutations will be represented by the swarm, and subsequently keeps track of which mutations remain to be included. Rare mutations, i.e., mutations detected fewer times than the minimum variant count over the entire sampling period, are disregarded. Selection among multiple sequences that carry a mutation is resolved by minimizing a series of distance criteria, first to minimize Hamming distance (number of mutations, gaps included) to the TF form among selected sites, then distance to the full-length TF sequence, and finally to minimize average distance to sequences in the current swarm set. The selected Env is included in the swarm set, counts in the table of needed mutations are set to zero, to indicate the particular mutation is now covered in the swarm, and iteration continues. This produces a “swarm” of Envs, which represents diversity in selected sites as it developed within the subject, given sampling constraints. Stacked boxes signify iteration. Unresolved ties are reported, though we have not yet encountered them in several large experimental sequence sets we have tested; such an outcome would signal the need for an alternative distance metric or more selection criteria.

References

    1. Plotkin S.A. Correlates of vaccine-induced immunity. Clin. Infect. Dis. 2008;47:401–409. doi: 10.1086/589862. - DOI - PubMed
    1. Mascola J.M., Montefiori D.M. The role of antibodies in HIV vaccines. Annu. Rev. Immunol. 2010;28:413–444. doi: 10.1146/annurev-immunol-030409-101256. - DOI - PubMed
    1. Mascola J.R., Lewis M.G., Stiegler G., Harris D., VanCott T.C., Hayes D., Louder M.K., Brown C.R., Sapan C.V., Frankel S.S., et al. Protection of macaques against pathogenic simian/human immunodeficiency virus 89.6PD by passive transfer of neutralizing antibodies. J. Virol. 1999;73:4009–4018. - PMC - PubMed
    1. Moldt B., Rakasz E.G., Schultz N., Chan-Hui P.Y., Swiderek K., Weisgrau K.L., Piaskowski S.M., Bergman Z., Watkins D.I., Poignard P., et al. Highly potent HIV-specific antibody neutralization in vitro translates into effective protection against mucosal SHIV challenge in vivo. Proc. Natl. Acad. Sci. USA. 2012;109:18921–18925. - PMC - PubMed
    1. Keele B., Giorgi E., Salazar-Gonzalez J., Decker J., Pham K., Salazar M., Sun C., Grayson T., Wang S., Li H., et al. Identification and characterization of transmitted and early founder virus envelopes in primary HIV-1 infection. Proc. Natl. Acad. Sci. USA. 2008;105:7552–7557. doi: 10.1073/pnas.0802203105. - DOI - PMC - PubMed

Publication types

Substances