. 2015 Oct 27;11(10):e1004494.
doi: 10.1371/journal.pcbi.1004494. eCollection 2015 Oct.

Predicting the Effect of Mutations on Protein-Protein Binding Interactions through Structure-Based Interface Profiles

Affiliations

Predicting the Effect of Mutations on Protein-Protein Binding Interactions through Structure-Based Interface Profiles

Jeffrey R Brender et al. PLoS Comput Biol. .

Abstract

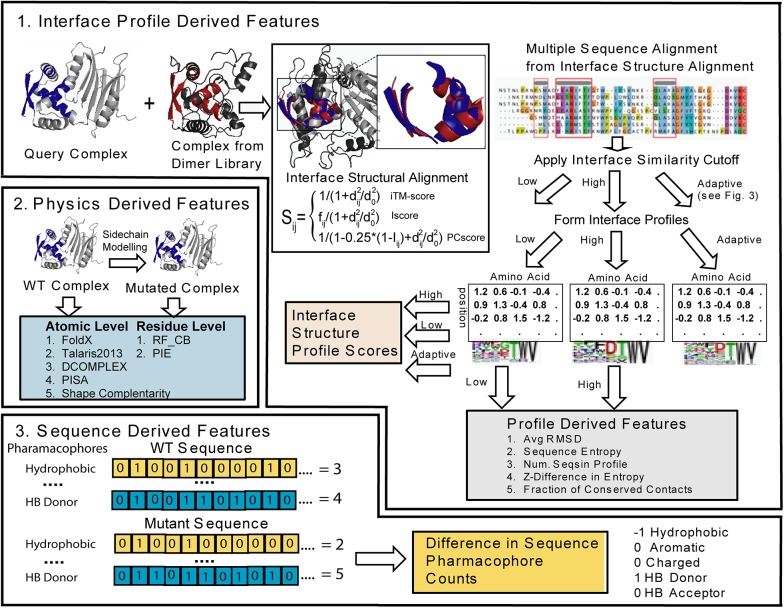
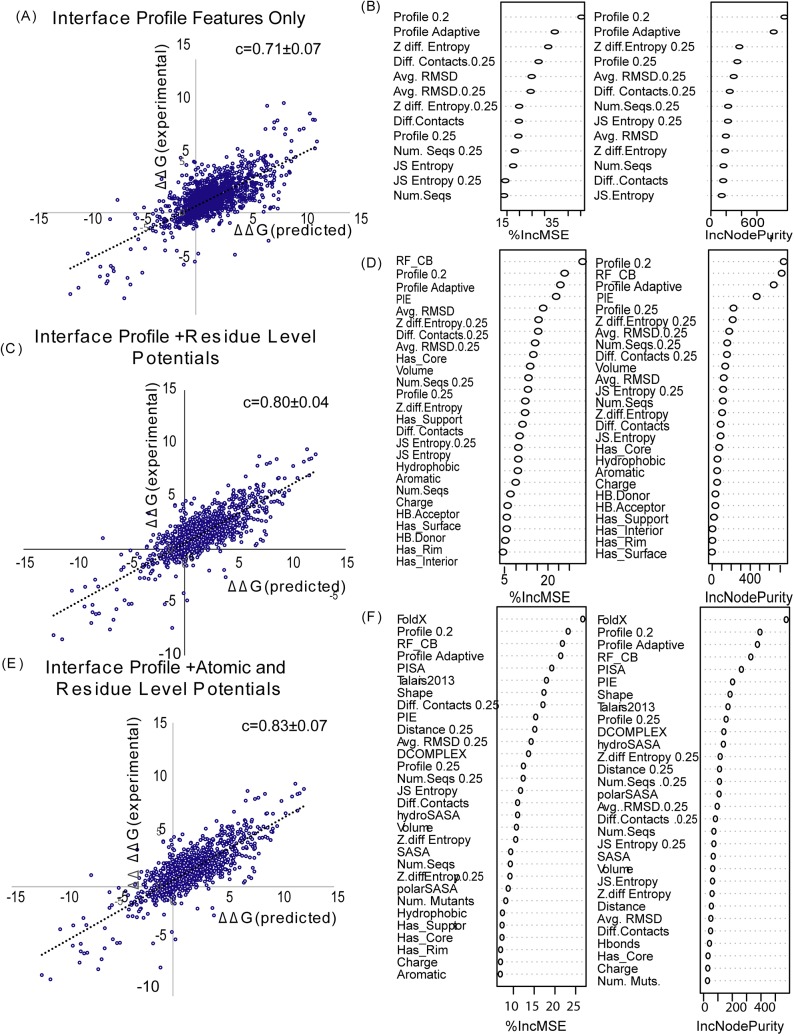
The formation of protein-protein complexes is essential for proteins to perform their physiological functions in the cell. Mutations that prevent the proper formation of the correct complexes can have serious consequences for the associated cellular processes. Since experimental determination of protein-protein binding affinity remains difficult when performed on a large scale, computational methods for predicting the consequences of mutations on binding affinity are highly desirable. We show that a scoring function based on interface structure profiles collected from analogous protein-protein interactions in the PDB is a powerful predictor of protein binding affinity changes upon mutation. As a standalone feature, the differences between the interface profile score of the mutant and wild-type proteins has an accuracy equivalent to the best all-atom potentials, despite being two orders of magnitude faster once the profile has been constructed. Due to its unique sensitivity in collecting the evolutionary profiles of analogous binding interactions and the high speed of calculation, the interface profile score has additional advantages as a complementary feature to combine with physics-based potentials for improving the accuracy of composite scoring approaches. By incorporating the sequence-derived and residue-level coarse-grained potentials with the interface structure profile score, a composite model was constructed through the random forest training, which generates a Pearson correlation coefficient >0.8 between the predicted and observed binding free-energy changes upon mutation. This accuracy is comparable to, or outperforms in most cases, the current best methods, but does not require high-resolution full-atomic models of the mutant structures. The binding interface profiling approach should find useful application in human-disease mutation recognition and protein interface design studies.


Conflict of interest statement

The authors have declared that no competing interests exist.

Figures

Fig 1
Fig 1. Pipeline of BindProf for predicting protein-binding affinity using features derived from interface structural profiles, wild type (WT) and mutant sequences, and physics based scoring of the structures of the WT and mutant complexes.
(1) Interface profile scores and Interface profile scores features are derived by profile scoring structural alignment of structurally similar interface using an interface similarity cutoff to define the aligned sequences that are used to build the profile. (2) Physics based scores are formed at the residue or atomic level formed by modeling the mutant monomeric protein and complex and evaluating the difference in energy. (3) Sequence features are formed by the difference between the WT and mutant sequences in the number of hydrophobic (V, I, L, M, F, W, or C), aromatic (Y, F, or W), charged (R, K, D, or E), hydrogen bond acceptors (D, E, N, H, Q, S, T, or Y), and hydrogen bond donating residues (R, K, W, N, Q, H, S, T, or Y) along with the difference in amino acid volume calculated from the sequence.
Fig 2
Fig 2. Comparison of the accuracy of mutant interface profile scores formed from different structural alignment methods in predicting ΔΔG of complex formation.
The iTM-score considers only structural similarity at the interface, Iscore considers structural similarity at the interface and the fraction of native contacts preserved, and PCscore considers both physicochemical and structural similarity at the interface. TM-score considers only structural alignment of the mutated monomeric protein. Profiles are constructed from sequences meeting each cutoff and the predicted ΔΔG values are calculated according to Eq 2.
Fig 3
Fig 3. Dependency of the accuracy of ΔΔG prediction on the number of sequences that can be aligned at the site of the mutation and the formation of an adaptive profile mixing sequences from high and low interface similarities.
Only single site mutations are considered (81% of the total number of mutations). N seq,mut and N seq, add are the number of sequences that can be aligned at the site of the mutation and the number of lower similarity sequences added to the profile, respectively. (A) Pearson’s correlation c between predicted and experimental ΔΔG values as a function of the number of sequences that can be aligned at the site of the mutation. (B) Fraction of the total number of single site mutations as a function of the number of sequences that can be aligned at the site of the mutation. (C) Improvement in accuracy of an adaptive profile mixing sequences from high and low interface similarities over profiles formed purely using high and low interface similarity cutoffs.
Fig 4
Fig 4. Comparison of the accuracy interface profile scores at ΔΔG compared to other physical, statistical, and sequence based potentials for all mutations in the SKEMPI dataset.
See text for a description of each potential.
Fig 5
Fig 5. Breakdown of the performance of the interface profile score compared to other potentials for different classes of mutations.
Favorable: ΔΔG ≤ 0 kcal/mol, Strongly Favorable ≤ -1 kcal/mol, Unfavorable: ΔΔG ≥ 0 kcal/mol, Strongly Unfavorable: ΔΔG ≥ 0 kcal/mol, Neutral ΔΔG ≤ 1 kcal/mol and ≥ 1 kcal/mol. See text for a description of each potential.
Fig 6
Fig 6. An illustration of the interface residue types onto the surface shown from the growth hormone-receptor complex structure (PDB ID: 1A22).
The monomer structure of one of the chains is shown on top with the complex structure on bottom. ‘Core’ residues (blue) are exposed in the monomeric structure but buried in the complex; ‘Support’ residues (green) are partly buried in the monomeric structure and fully buried in the complex; ‘Rim’ residues (orange) are fully exposed in the monomeric structure and partly buried in the complex; ‘Interior’ residues (sky blue) are fully buried in the monomer, while surface residues (red) are fully exposed in both the monomeric and complex structures.
Fig 7
Fig 7. Median and interquartile ranges of experimental ΔΔG values by interface classification.
Full distributions can be found in the Supporting Information as S1 Fig.
Fig 8
Fig 8. Median and interquartile ranges of the RMSD of the alignment at the mutation site at low (Iscore = 0.19) (A) and high (Iscore = 0.25) (B) interface similarity.
Fig 9
Fig 9. Breakdown of the performance of the interface profile score compared to other potentials for different types of interface residues.
See Fig 6 for the definition of the interface residue types.
Fig 10
Fig 10. Prediction of ΔΔG value by different combinations of the interface profile scores.
(A) Interface profile only; (B) Interface profile and residue level potentials; (C) Interface potential, residue level potentials, and atomic level potentials. In each picture, the right panel shows the overall correlation between predicted and experimental ΔΔG values; the right penal shows different features from random forest model as sorted by their effect on the residual error (right) or the node purity (a measure of the efficiency of splitting on feature during the construction of the decision tree) (left). Correlation values are for 10 fold cross-validation repeated three times.
Fig 11
Fig 11. Accuracy of ΔΔG prediction on a per protein basis after leave-one-protein-out cross-validation for the 24 proteins with more than 10 mutants available based on the standard error of prediction.
Proteins are arranged left to right in order from the low to high mean experimental ΔΔG value. The mean standard error across the set increases from 1.11 kcal/mol to 1.33 kcal/mol if the tested protein is left out during training.

References

    1. Cargill M, Altshuler D, Ireland J, Sklar P, Ardlie K, Patil N, et al. Characterization of single-nucleotide polymorphisms in coding regions of human genes. Nature genetics. 1999; 22(3): 231–8. - PubMed
    1. Sachidanandam R, Weissman D, Schmidt SC, Kakol JM, Stein LD, Marth G, et al. A map of human genome sequence variation containing 1.42 million single nucleotide polymorphisms. Nature. 2001; 409(6822): 928–33. - PubMed
    1. Kortemme T, Baker D. Computational design of protein-protein interactions. Current opinion in chemical biology. 2004; 8(1): 91–7. - PubMed
    1. Leavitt S, Freire E. Direct measurement of protein binding energetics by isothermal titration calorimetry. Current opinion in structural biology. 2001; 11(5): 560–6. - PubMed
    1. Kastritis PL, Bonvin AM. On the binding affinity of macromolecular interactions: daring to ask why proteins interact. Journal of the Royal Society, Interface / the Royal Society. 2013; 10(79): 20120835 10.1098/rsif.2012.0835 - DOI - PMC - PubMed

Publication types