. 2015 Dec;7(12):1611-21.
doi: 10.1039/c5ib00240k. Epub 2015 Oct 28.

Coupling between apical tension and basal adhesion allow epithelia to collectively sense and respond to substrate topography over long distances

Affiliations

Coupling between apical tension and basal adhesion allow epithelia to collectively sense and respond to substrate topography over long distances

Kyle E Broaders et al. Integr Biol (Camb). 2015 Dec.

Abstract

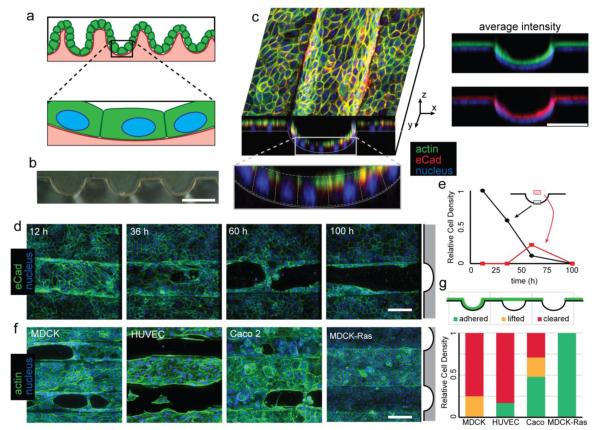
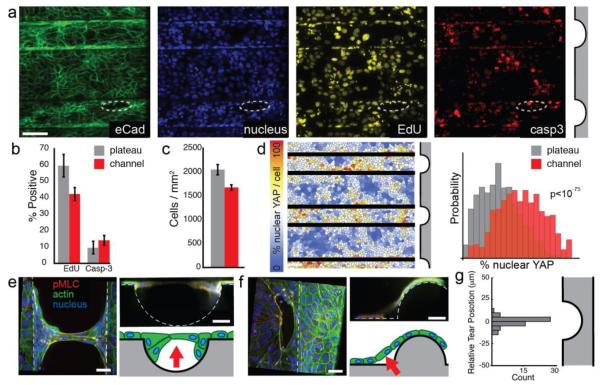
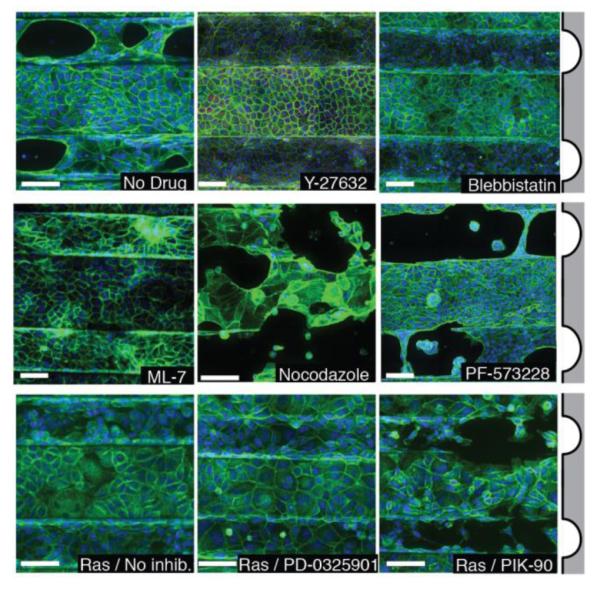
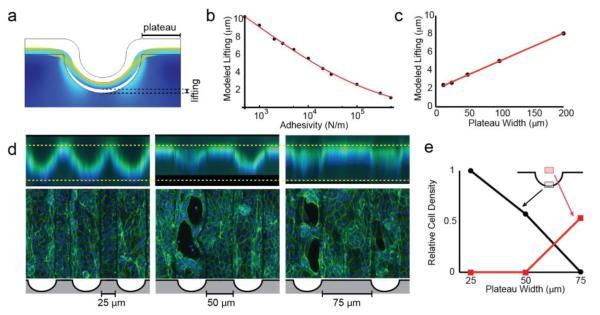
Epithelial sheets fold into complex topographies that contribute to their function in vivo. Cells can sense and respond to substrate topography in their immediate vicinity by modulating their interfacial mechanics, but the extent to which these mechanical properties contribute to their ability to sense substrate topography across length scales larger than a single cell has not been explored in detail. To study the relationship between the interfacial mechanics of single cells and their collective behavior as tissues, we grew cell-sheets on substrates engraved with surface features spanning macroscopic length-scales. We found that many epithelial cell-types sense and respond to substrate topography, even when it is locally nearly planar. Cells clear or detach from regions of local negative curvature, but not from regions with positive or no curvature. We investigated this phenomenon using a finite element model where substrate topography is coupled to epithelial response through a balance of tissue contractility and adhesive forces. The model correctly predicts the focal sites of cell-clearing and epithelial detachment. Furthermore, the model predicts that local tissue response to substrate curvature is a function of the surrounding topography of the substrate across long distances. Analysis of cell-cell and cell-substrate contact angles suggests a relationship between these single-cell interfacial properties, epithelial interfacial properties, and collective epithelial response to substrate topography. Finally, we show that contact angles change upon activation of oncogenes or inhibition of cell-contractility, and that these changes correlate with collective epithelial response. Our results demonstrate that in mechanically integrated epithelial sheets, cell contractility can be transmitted through multiple cells and focused by substrate topography to affect a behavioral response at distant sites.


Figures

Figure 1
Figure 1
Epithelial tissues clear from large-scale curvature. (A) Epithelial sheets having large-scale curvature can be nearly flat on the length scale of a single cell. (B) Cross-section of a PDMS substrate. (C) XY and XZ cross-sectional view of a confluent monolayer of MDCK on a curved PDMS substrate taken 12 h after seeding of cells. Average intensity of actin (green) and eCad (red) staining relative to cell nuclei (blue). (D) Time course showing cells clearing selectively from channels. Channel location indicated by gray schematic (right) (E) Quantitation of fluorescence from the indicated region showing lifting of tissues coincident with clearing. (F) 48 h fluorescence micrographs of MDCK, HUVEC, and Caco2, and Ras-transformed MDCK. (G) Quantitation of proportion adhered, lifted, and cleared tissue for each cell type. All scale bars: 100 μm.
Figure 2
Figure 2
Clearing involves mechanical stress, and does not require differential proliferation or apoptosis. (A) Multichannel fluorescence imaging of EdU uptake and cleaved caspase-3 staining in channels and in nascent tissue discontinuities (circled). Scale bar 100 μm. (B) Percentage of EdU and Casp3 positive cells in channel and plateau regions. (C) Cell density compared between channel and plateau regions. (D) Per-cell quantification of nuclear YAP localization. Channel edges are masked to avoid double-counting cells (E-F) High-magnification images of lifted tissues at channels or ridges shows cells lifted from regions of negative curvature with anchoring cells remaining at the edges of the discontinuity. Note: dehydration by mounting medium causes reduction of tissue thickness. Schematic arrows indicate direction and locus of lifting. (G) Histogram of tear centroid positions relative to their local channel center (n = 56). Scale bars: 20 μm. All error bars are 95% confidence intervals.
Figure 3
Figure 3
Treatment of cells with small-molecule drugs that modulate cell physicochemical properties affects their response to topography. MDCK cells treated with Y-27632, blebbistatin, or ML-7 do not clear, while untreated cells and those treated with Nocodazole or PF-573228 do clear (top two rows). MDCK-Ras cells do not clear, nor do MDCK-Ras cells treated with PD-0325901, but treatment with PIK-90 restores clearing (bottom row). Scale bars: 100 μm.
Figure 4
Figure 4
FEM modeling supports a mechanism where apical tension is transmitted to basal cell-ECM adhesions. (A) Model output, with tissues treated as a contractile continuum adhered to a substrate. (B) Plot showing the modeled extent of lifting as a function of adhesion strength between the tissue and substrate. (C) Plot showing the modeled extent of lifting as a function of plateau width between channels. (D) Cells grown on substrates with increasing plateau width. Lifting can be seen in the XY views (top) and clearing can be seen in XY projections (bottom) in tissues that lift. (E) Quantification of lifting and tearing as a function of plateau width between channels.
Figure 5
Figure 5
Single cell morphometric analysis is diagnostic of the capacity to sense and respond to large-scale substrate topography. (A) Diagram indicating the balance of forces acting within contracting monolayers on curved substrates. Blue represents tension at the apical surface; purple indicates tension at the cell-cell interface; red indicates tension across cell-substrate adhesions. (B) Representative single radial slice indicating the contact angle (θ) at the cell-substrate interface. (C) Average cell-substrate contact angle measured under the indicated conditions. Light gray: cells detach or clear, dark gray: no detachment. (D) The contact angle at the cell-cell interface (φ) was measured 4 h after seeding into agarose microwells. (E) Overlay of phase contrast images and fluorescence micrographs of actin or eCad stained cells showing polarization of doublets. (F) Average cell-cell contact angle measured under the indicated conditions. (G) The ratio of cos φ to sin θ from 5D and 5E under the indicated conditions. Red qualitatively highlights ratios that do not detach; green highlights those that do. All error bars are 95% confidence intervals. All scale bars: 10 μm.

References

    1. Gibson WT, Gibson MC. Curr. Top. Dev. Biol. 2009;89:87–114. - PubMed
    1. Eberwein P, Reinhard T. Stem Cells. 2015;33:916–924. - PubMed
    1. Bullen TF, Forrest S, Campbell F, Dodson AR, Hershman MJ, Pritchard DM, Turner JR, Montrose MH, Watson AJM. Lab. Invest. 2006;86:1052–1063. - PubMed
    1. Kouznetsova I, Kalinski T, Meyer F, Hoffmann W. Mol Biosyst. 2011;7:1105–1112. - PubMed
    1. Mata A, Boehm C, Fleischman AJ, Muschler GF, Roy S. International journal of nanomedicine. 2007;2:389–406. - PMC - PubMed

Publication types