. 2016 Jan 4;44(D1):D917-24.
doi: 10.1093/nar/gkv1101. Epub 2015 Oct 26.

BloodSpot: a database of gene expression profiles and transcriptional programs for healthy and malignant haematopoiesis

Affiliations

BloodSpot: a database of gene expression profiles and transcriptional programs for healthy and malignant haematopoiesis

Frederik Otzen Bagger et al. Nucleic Acids Res. .

Abstract

Research on human and murine haematopoiesis has resulted in a vast number of gene-expression data sets that can potentially answer questions regarding normal and aberrant blood formation. To researchers and clinicians with limited bioinformatics experience, these data have remained available, yet largely inaccessible. Current databases provide information about gene-expression but fail to answer key questions regarding co-regulation, genetic programs or effect on patient survival. To address these shortcomings, we present BloodSpot (www.bloodspot.eu), which includes and greatly extends our previously released database HemaExplorer, a database of gene expression profiles from FACS sorted healthy and malignant haematopoietic cells. A revised interactive interface simultaneously provides a plot of gene expression along with a Kaplan-Meier analysis and a hierarchical tree depicting the relationship between different cell types in the database. The database now includes 23 high-quality curated data sets relevant to normal and malignant blood formation and, in addition, we have assembled and built a unique integrated data set, BloodPool. Bloodpool contains more than 2000 samples assembled from six independent studies on acute myeloid leukemia. Furthermore, we have devised a robust sample integration procedure that allows for sensitive comparison of user-supplied patient samples in a well-defined haematopoietic cellular space.


Figures

Figure 1.
Figure 1.
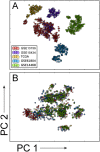
Principal component analysis (PCA) plot of BloodPool samples. (A) before batch correction, (B) after batch correction. Batches are coloured by study of origin.
Figure 2.
Figure 2.
BloodSpot interface details. After a gene alias is submitted to display its expression pattern, any of the top three panels can be clicked to magnify content. The three panels show, from left to right, a survival plot based on a high-quality AML data set displaying a full Kaplan–Meier analysis for any query gene or gene signature, an improved jitter strip chart of gene-expression plot that draws from bar plots and violin plots and an interactive hierarchical tree that shows the relationship between the samples displayed and allows changing the focus of the display. The Select Population button allows the user to select which populations to display. The Gene Correlations button shows in a table how much other genes or gene signatures correlate with the displayed gene. It is possible to click on the genes in the table to display their expression profile. The Print as PDF button allows the user to export the current plot in PDF format. The T-Test button allows you to perform significance test between pairs of populations (legend is as follows: NS: non significant; *P < 0.05; **P < 0.01; ***P < 0.001). The Export Data as Text button allows you to export the raw data as text (CSV format). The Upload your own sample button allows for the upload of an Affymetrix HU133 plus 2.0 .CEL file and for viewing it in the context of normal haematopoiesis. The drop down menu in the upper right corner of the main plot can be used to select a probe representing the gene of interest; by default, the probe with the highest intensity is chosen. At the bottom of the main plot, a list of abbreviations is available that includes immunophenotypes when applicable.
Figure 3.
Figure 3.
Main plots from BloodSpot for MEIS1. (A) Default view in BloodSpot. The plot is a novel improved jitter strip chart of gene expression that draws from bar plots and violin plots where the jitter is controlled by the density of samples and normalised over all the columns in the chart. (B) Survival plot based on a high-quality AML data set from The Cancer Genome Atlas (TCGA). It displays a full Kaplan–Meier analysis of survival. The survival plots are only available for human data sets, sharing probes with the microarray platform used by the TCGA. (C) Interactive hierarchical tree that shows the relationship between the samples displayed. Hovering over the nodes provides the full names of cell populations. Nodes can be clicked to collapse a branch of the tree—this will also update the default plot in the middle and remove the same populations there. The colour in the nodes represents the median expression of the queried gene. To accentuate the display in the trees, node size is also proportional to gene expression. Trees are based on literature (hierarchical differentiation), or overall sample correlation (correlation of samples). (D) Example table of genes and gene signatures correlating with MEIS1 expression in the default data set. This table appears when the user clicks on the ‘correlation’ button.
Figure 4.
Figure 4.
MEIS1 expression relative to the nearest normal counterpart in different AML subtypes, including MLL-rearranged AML.

References

    1. Miller J.C., Brown B.D., Shay T., Gautier E.L., Jojic V., Cohain A., Pandey G., Leboeuf M., Elpek K.G., Helft J., et al. Deciphering the transcriptional network of the dendritic cell lineage. Nat. Immunol. 2012;13:888–899. - PMC - PubMed
    1. Novershtern N., Subramanian A., Lawton L.N., Mak R.H., Haining W.N., McConkey M.E., Habib N., Yosef N., Chang C.Y., Shay T., et al. Densely interconnected transcriptional circuits control cell states in human hematopoiesis. Cell. 2011;144:296–309. - PMC - PubMed
    1. Bagger F.O., Rapin N., Theilgaard-Mönch K., Kaczkowski B., Thoren L.A., Jendholm J., Winther O., Porse B.T. HemaExplorer: a database of mRNA expression profiles in normal and malignant haematopoiesis. Nucleic Acids Res. 2013;41:D1034–D1039. - PMC - PubMed
    1. Seita J., Sahoo D., Rossi D.J., Bhattacharya D., Serwold T., Inlay M.A., Ehrlich L.I., Fathman J.W., Dill D.L., Weissman I.L. Gene Expression Commons: an open platform for absolute gene expression profiling. PLoS One. 2012;7:e40321. - PMC - PubMed
    1. Watkins N.A., Gusnanto A., de Bono B., De S., Miranda-Saavedra D., Hardie D.L., Angenent W.G.J., Attwood A.P., Ellis P.D., Erber W. A HaemAtlas: characterizing gene expression in differentiated human blood cells. Blood. 2009;113:e1–e9. - PMC - PubMed

Publication types