

Race and sex disparities in long-term survival of oral and oropharyngeal cancer in the United States
- PMID: 26507889
- PMCID: PMC11819284
- DOI: 10.1007/s00432-015-2061-8
Race and sex disparities in long-term survival of oral and oropharyngeal cancer in the United States
Abstract
Purpose: To investigate the effect of race and sex on long-term survival of oral and oropharyngeal cancer.
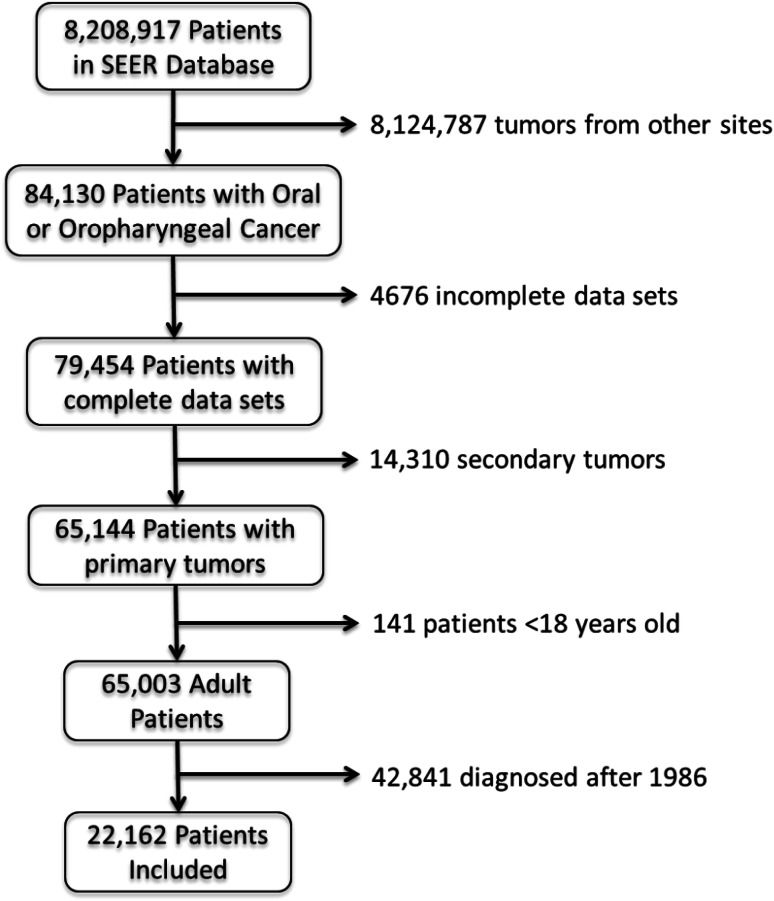
Methods: The Surveillance, Epidemiology and End Results database was queried for adult oral and oropharyngeal cancer patients with at least 25-year follow-up. Kaplan-Meier survival curves and cox proportional hazards model were used to identify differences.
Results: Of the 22,162 patients identified, 70.3% were males. Only 8.9% were alive at 25 years post-diagnosis. Black males show the poorest overall and disease-specific survival rates (p < 0.001). After controlling for covariates, Blacks had a 40% higher hazard of mortality compared with Whites (HR 1.40, 95% CI 1.35-1.46), while females had a 9% reduction in mortality risk (HR 0.91, 95% CI 0.88-0.94).
Conclusions: Overall and disease-specific survival is poor for oral and oropharyngeal cancer patients, and Black men fare worst. This illustrates the need for long-term cancer survival plans incorporating disparity effects in overall cancer outcomes.
Keywords: Long-term survival; Oral cavity cancer; Oropharyngeal cancer; Outcomes; Racial and sex disparities.
Conflict of interest statement
None of the authors have any conflict of interest to declare.
Figures


References
-
- American Cancer Society (2015) Cancer facts and figures 2015. American Cancer Society, Atlanta
-
- Amit M et al (2013) Improvement in survival of patients with oral cavity squamous cell carcinoma: an international collaborative study. Cancer 119:4242–4248 - PubMed
-
- Arbes SJ, Olshan AF, Caplan DJ, Schoenbach VJ, Slade GD, Symons MJ (1999) Factors contributing to the poorer survival of black Americans diagnosed with oral cancer (United States). Cancer Causes Control 10:513–523 - PubMed
-
- Barker BF, Barker GJ (2001) Oral management of the patient with cancer in the head and neck region. J Calif Dent Assoc 29:619–623 - PubMed
-
- Barker GJ, Epstein JB, Williams KB, Gorsky M, Raber-Durlacher JE (2005) Current practice and knowledge of oral care for cancer patients: a survey of supportive health care providers. Support Care Cancer 13:32–41 - PubMed
MeSH terms
LinkOut - more resources
Full Text Sources
Medical
