Review
. 2016 Apr 14;37(15):1196-207.
doi: 10.1093/eurheartj/ehv529. Epub 2015 Oct 27.

Myocardial strain imaging: how useful is it in clinical decision making?

Affiliations
Review

Myocardial strain imaging: how useful is it in clinical decision making?

Otto A Smiseth et al. Eur Heart J. .

Abstract

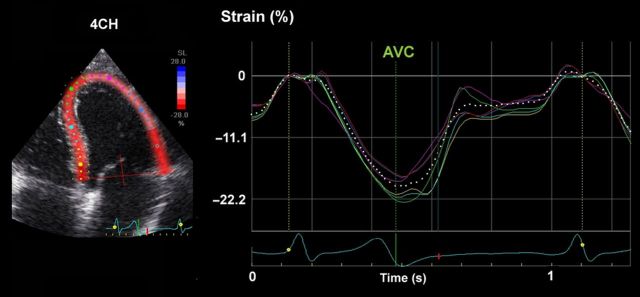
Myocardial strain is a principle for quantification of left ventricular (LV) function which is now feasible with speckle-tracking echocardiography. The best evaluated strain parameter is global longitudinal strain (GLS) which is more sensitive than left ventricular ejection fraction (LVEF) as a measure of systolic function, and may be used to identify sub-clinical LV dysfunction in cardiomyopathies. Furthermore, GLS is recommended as routine measurement in patients undergoing chemotherapy to detect reduction in LV function prior to fall in LVEF. Intersegmental variability in timing of peak myocardial strain has been proposed as predictor of risk of ventricular arrhythmias. Strain imaging may be applied to guide placement of the LV pacing lead in patients receiving cardiac resynchronization therapy. Strain may also be used to diagnose myocardial ischaemia, but the technology is not sufficiently standardized to be recommended as a general tool for this purpose. Peak systolic left atrial strain is a promising supplementary index of LV filling pressure. The strain imaging methodology is still undergoing development, and further clinical trials are needed to determine if clinical decisions based on strain imaging result in better outcome. With this important limitation in mind, strain may be applied clinically as a supplementary diagnostic method.

Keywords: Cardiomyopathy; Chemotherapy; Heart failure; Hypertrophic cardiomyopathy; Left atrial strain; Left ventricular function; Strain imaging; Ventricular arrhythmia.


Figures

Figure 1
Figure 1
Segmental strains in apical four-chamber view, showing normal contractions. The color of each trace corresponds to anatomical points on the 2-D color image to the left. The white dotted line represents average strain.
Figure 2
Figure 2
Left panels: left ventricular short-axis view from a healthy individual showing higher radial strains in inner than outer layer. Right panel: Transmural difference in radial strain is a pure geometrical effect, since reduction in external diameter of a passive circular structure leads to more thickening of inner than outer layers. The figure simulates reduction of inner radius by 25% and the numbers indicate the resulting thickening in inner, mid and outer wall layers.
Figure 3
Figure 3
Left panel: Strain by sonomicrometry in an anaesthetized dog model showing normal contraction in the upper left corner. In the upper right corner, a recording during coronary stenosis showing reduced systolic shortening in combination with marked post-systolic shortening, which implies active contraction and therefore viable myocardium. The two lower recordings illustrate dyskinesia during coronary occlusion. The lower left shows early-systolic lengthening, followed by late and post-systolic shortening, consistent with some degree of active contraction. The lower right recording shows myocardium with no active contraction and reflects the effect of the time-varying left ventricular pressure on the passively behaving myocardium ED = end diastole. Modified from Lyseggen and Skulstad. Right panel: myocardial strain by tissue Doppler imaging in a patient with acute anterior myocardial infarction. A series of recordings along the septum are displayed. The color of each trace corresponds to anatomical points on the 2-D images to the left. These traces have features similar to the recordings by sonomicrometry in the left panel, illustrating the ability of strain by echocardiography to reflect myocardial segmental contraction Courtsey of Erik Lyseggen.
Figure 4
Figure 4
Patient with anterior myocardial infarction. Each trace represents one LV segment. Apical segments are dyskinetic (blue colour in bull's eye plot) while other segments are hypokinetic.
Figure 5
Figure 5
Strain imaging in patient with atypical symptoms, no chest pain and no signs of ischaemia in electrocardiogram. Each trace represents one LV segment. Possible inferior wall hypokinesia on grey scale imaging. Strain imaging showed moderately reduced systolic shortening and marked post-systolic shortening in the inferior wall (red circle). The patient was referred for angiography which revealed a subtotal stenosis of the right coronary artery (right panel) and was successfully treated with percutaneous coronary intervention. ES = end systole.
Figure 6
Figure 6
Longitudinal strain by speckle-tracking echocardiography (two-chamber view) in a patient with acute myocardial infarction the day after percutaneous coronary intervention of an occluded left anterior descending coronary artery. Follow-up late enhancement cardiac magnetic resonance (lower left) showed myocardial scarring represented by the white area in apex and anterior wall. Strain curves display typical features of ischaemic dysfunction, ranging from lengthening throughout systole in a segment with transmural infarction and different degrees of dysfunction in other segments. The color of each trace corresponds to anatomical points on the 2-D color image and the white dotted line shows the average of the six strain curves. The yellow curve shows normal contraction in a non-infarcted segment.
Figure 7
Figure 7
Longitudinal strain curves from apical four-chamber view in a 28-year-old male who was positive for a hypertrophic cardiomyopathy-related mutation in the MYBPC3 gene detected by family genetic screening. The color of each trace corresponds to anatomical points on the 2-D color image to the left. Average strain from four-chamber view was 14% (white dotted trace) and global longitudinal strain was 16%, indicating reduced longitudinal function. Ejection fraction was 57%. He was asymptomatic and had no hypertrophy by echocardiography, cardiac magnetic resonance nor by electrocardiography. Green vertical line indicates timing of AVC.
Figure 8
Figure 8
Strain imaging for early detection of sub-clinical left ventricular dysfunction during chemotherapy. Modified from Plana et al. *The data supporting the initiation of cardioprotection for the treatment of sub-clinical left ventricular dysfunction is limited.
Figure 9
Figure 9
In patients with preserved left ventricular ejection fraction (>40%) after myocardial infarction those with absolute global longitudinal strain <14% had increased risk for the combined endpoint of all-cause mortality and heart failure admission. Months on x axis. Modified from Ersboll et al.
Figure 10
Figure 10
Left panel shows synchronous contraction by longitudinal strain in a patient after myocardial infarction. Mid panel shows heterogeneous timing of contraction and pronounced mechanical dispersion in a patient after myocardial infarction with ventricular arrhythmias. Right panel shows better arrhythmia free event rate in those with mechanical dispersion <75 ms.
Figure 11
Figure 11
Left ventricular strain in hypertension and heart failure with preserved ejection fraction (HFpEF). Left panel: average longitudinal and circumferential systolic strain among normal controls (n = 50), hypertensive heart disease (n = 44) and heart failure with preserved ejection fraction (n = 219). Right panel: three categories heart failure with preserved ejection fraction based on left ventricular ejection fraction. *P < 0.0001 vs. controls and between hypertensive heart disease and heart failure with preserved ejection fraction overall for longitudinal strain and circumferential strain. #P < 0.0002 vs. controls. Left ventricular ejection fraction-adjusted P < 0.001 compared with controls.
Figure 12
Figure 12
Recording of left ventricular longitudinal strain by speckle-tracking echocardiography in a patient with heart failure and left bundle branch block: there is a characteristic left bundle branch block pattern with early-systolic shortening in the septum (blue arrows), combined with early (pre-stretch) in the lateral wall (yellow arrow), and late peak contraction in the lateral wall (red arrow). AVC, aortic valve closure. Modified from Risum et al.
Figure 13
Figure 13
The figure illustrates how radial strain may be used to determine which segments have latest mechanical activation. A left ventricular parasternal short-axis recording is displayed. Strain in anteroseptal segment shows early-systolic thickening (yellow curve). Lateral (light blue), posterior (green and pink), and posterioseptal segments (blue and red) show late thickening, indicating latest activation.
Figure 14
Figure 14
(A and B) Left atrial (LA) strain by two different speckle-tracking software. (A) Segmental traces of LA strain and average strain (white-dashed trace). Yellow arrow indicates peak strain. Modified from Cameli et al. (B) Relationship between LA strain and left ventricular end-diastolic pressure.
Figure 15
Figure 15
Average (±standard deviation) global longitudinal strain of all study subjects presented per vendor. The study was done in individuals with normal to severely impaired left ventricular function. As shown in the table, there was a significant differences between most vendors (P < 0.00). Blue dot, P < 0.05.

References

    1. Waldman LK, Fung YC, Covell JW. Transmural myocardial deformation in the canine left ventricle. Normal in vivo three-dimensional finite strains. Circ Res 1985;57:152–163. - PubMed
    1. Heimdal A, Stoylen A, Torp H, Skjaerpe T. Real-time strain rate imaging of the left ventricle by ultrasound. J Am Soc Echocardiogr 1998;11:1013–1019. - PubMed
    1. Urheim S, Edvardsen T, Torp H, Angelsen B, Smiseth OA. Myocardial strain by Doppler echocardiography. Validation of a new method to quantify regional myocardial function. Circulation 2000;102:1158–1164. - PubMed
    1. Amundsen BH, Helle-Valle T, Edvardsen T, Torp H, Crosby J, Lyseggen E, Stoylen A, Ihlen H, Lima JA, Smiseth OA, Slordahl SA. Noninvasive myocardial strain measurement by speckle tracking echocardiography: validation against sonomicrometry and tagged magnetic resonance imaging. J Am Coll Cardiol 2006;47:789–793. - PubMed
    1. Jasaityte R, Heyde B, D'Hooge J. Current state of three-dimensional myocardial strain estimation using echocardiography. J Am Soc Echocardiogr 2013;26:15–28. - PubMed

Publication types

MeSH terms

Substances