. 2015 Nov 3;112(44):13439-46.
doi: 10.1073/pnas.1511912112. Epub 2015 Oct 27.

Accelerating scientific publication in biology

Affiliations

Accelerating scientific publication in biology

Ronald D Vale. Proc Natl Acad Sci U S A. .

Abstract

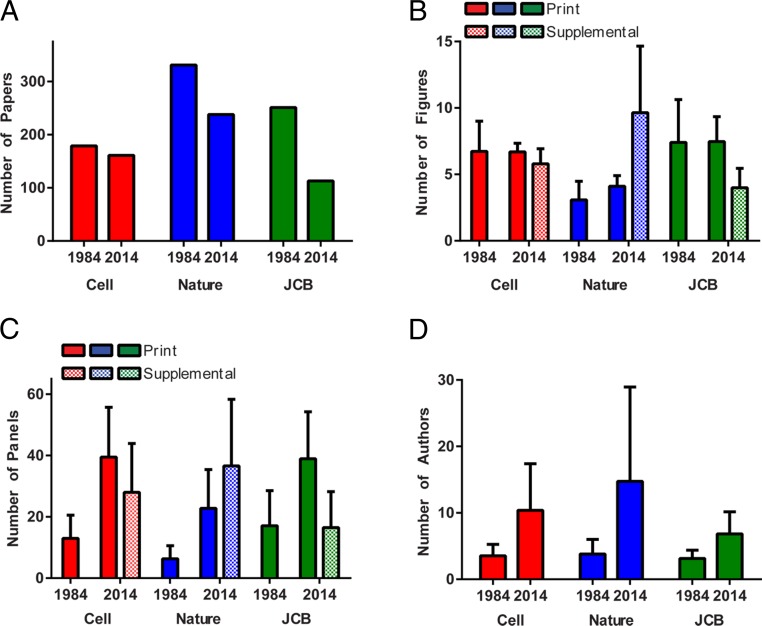
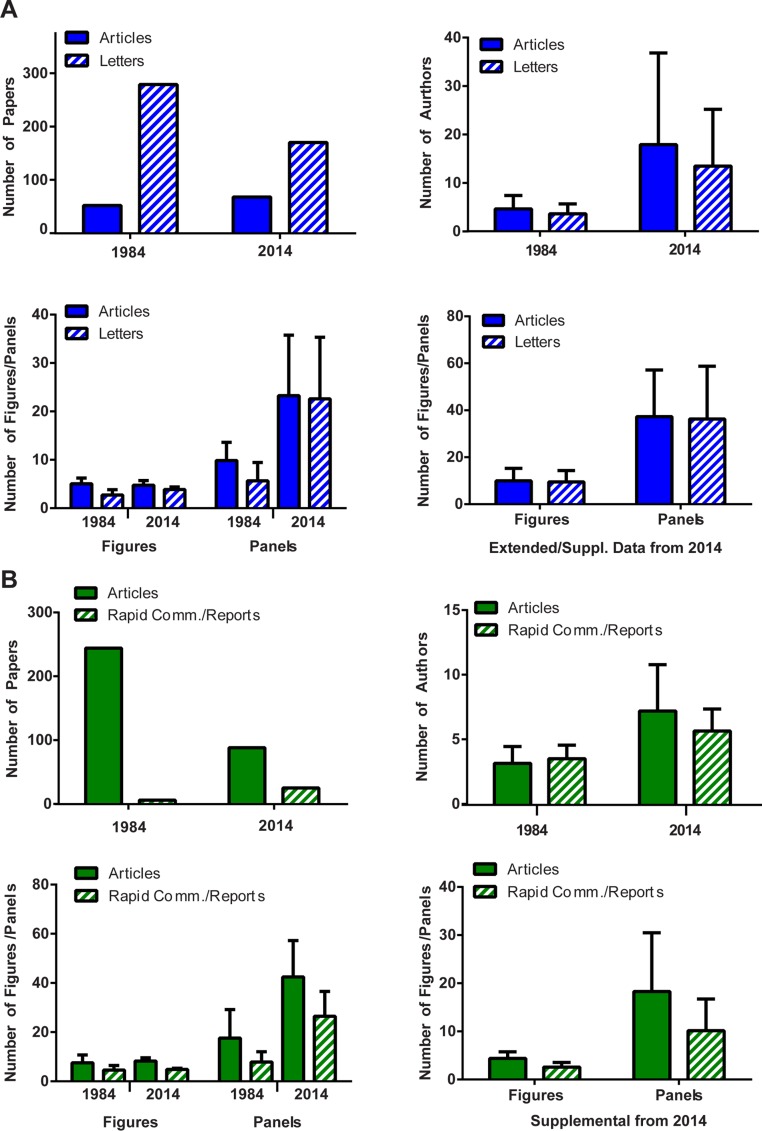
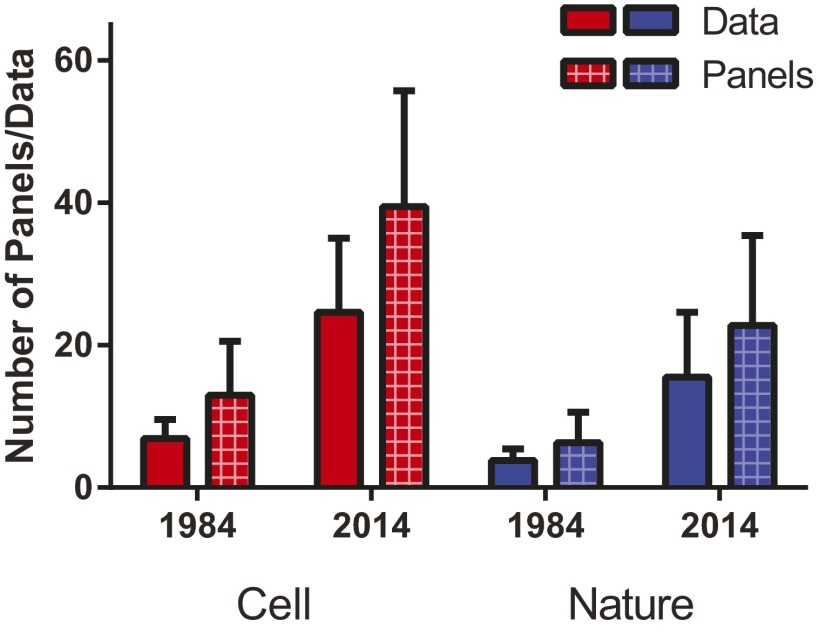
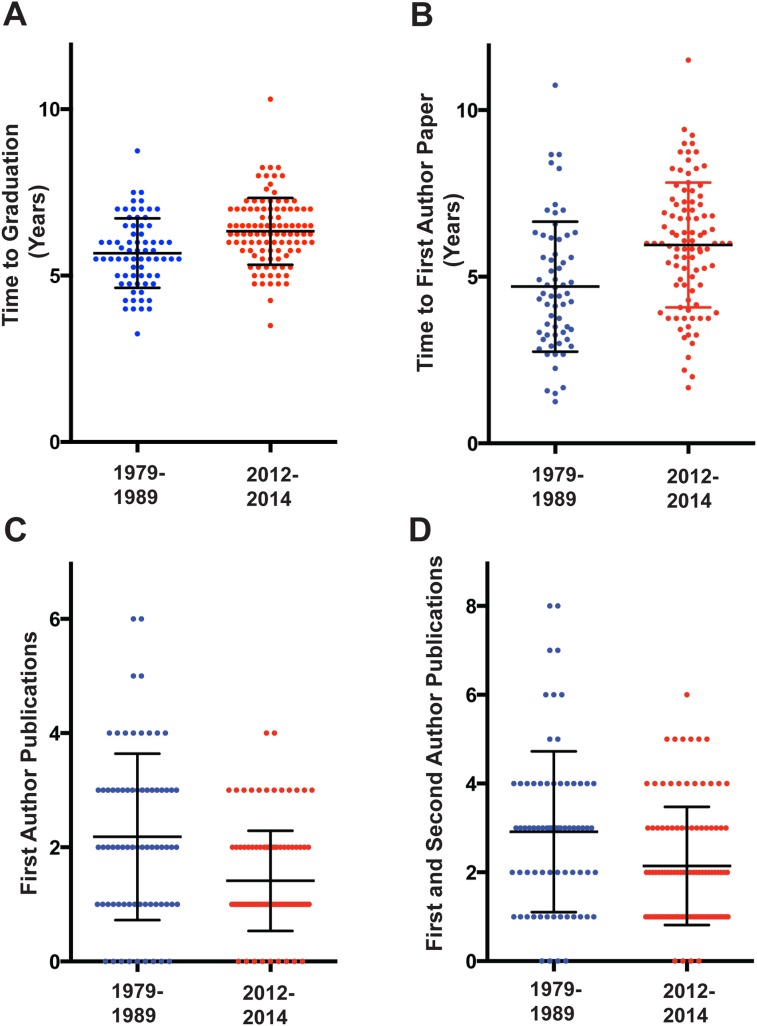
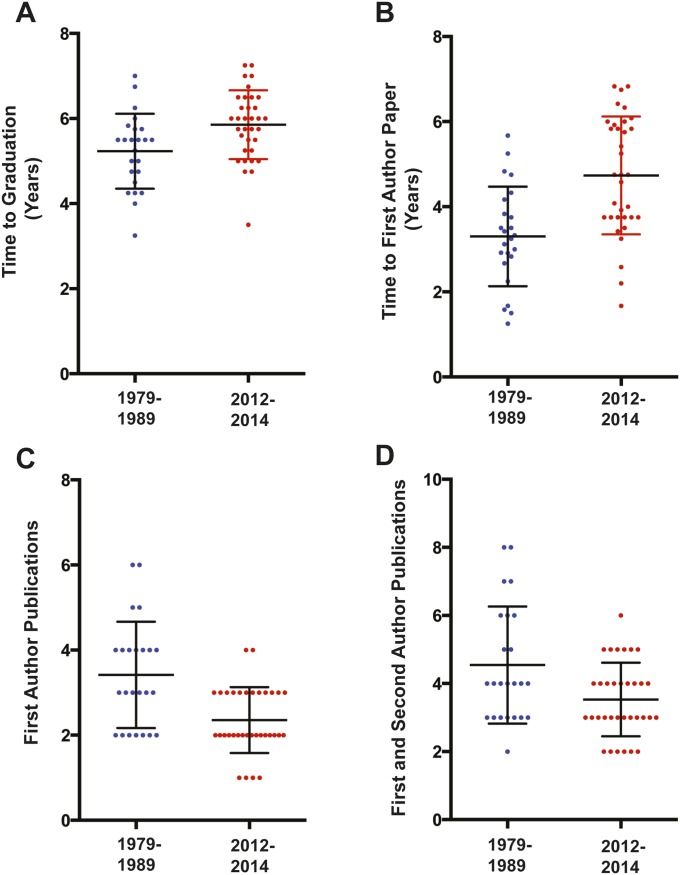
Scientific publications enable results and ideas to be transmitted throughout the scientific community. The number and type of journal publications also have become the primary criteria used in evaluating career advancement. Our analysis suggests that publication practices have changed considerably in the life sciences over the past 30 years. More experimental data are now required for publication, and the average time required for graduate students to publish their first paper has increased and is approaching the desirable duration of PhD training. Because publication is generally a requirement for career progression, schemes to reduce the time of graduate student and postdoctoral training may be difficult to implement without also considering new mechanisms for accelerating communication of their work. The increasing time to publication also delays potential catalytic effects that ensue when many scientists have access to new information. The time has come for life scientists, funding agencies, and publishers to discuss how to communicate new findings in a way that best serves the interests of the public and the scientific community.

Keywords: PhD training; arXiv; career advancement; journals; scientific publication.


Conflict of interest statement

The author declares no conflict of interest.

Figures

Fig. 1.
Fig. 1.
Statistics for papers published in Cell, Nature (biology papers only), and The Journal of Cell Biology (JCB) for the months of January–June in 1984 and 2014. Long and short format papers (articles and letters for Nature, and articles and reports/rapid communications for JCB) are grouped together in this figure, but analysis of each category can be found in Fig. S1. (A) The total number of papers published during these two 6-mo time periods. (B) The average number of figures in the print and online supplement of each paper. For Nature, most of the data in this figure are derived from the “Extended Data” section although the “Supplemental Information” section also contributes some data in this analysis. An online supplement did not exist for journals in 1984. (C) The number of panels per paper (assigned as a letter in the figure; tables were also scored in this category). (D) The average number of authors per paper. The means and SDs are shown in BD. See SI Methods for details on analysis. See Fig. S2 for an analysis of the pieces of distinct experimental data contained within the panels of the print versions of Cell and Nature.
Fig. S1.
Fig. S1.
Breakdown of information for long and short format papers. (A) Data for Nature: long format (Articles) and short format (Letters). (B) Data for The Journal of Cell Biology (JCB): long format (Articles) and short format [Rapid Communications (1984 name) or Reports (2014 name)]. The means and SDs are shown. These data from long and short format papers were combined together in the analysis in Fig. 1.
Fig. S2.
Fig. S2.
Analysis of the number of panels (assigned as a letter in the figure) and distinct pieces of experimental data in the print versions of Cell and Nature. Each piece of “data” is defined as being derived from a distinct experiment or a significant type of new analysis (see SI Methods); as an example, two panels that show two views of a micrograph would be considered as a single datum in this analysis. The means and SDs are shown. Although the scoring of “distinct data” is admittedly subjective, the analysis shows an approximately similar ratio of data to panels in the two journals and between the two different time periods.
Fig. S3.
Fig. S3.
Scatter plot of data on (A) time to graduation, (B) time to the first first-author publication from entering graduate school, (C) number of first-author publications, and (D) number of first- and second-author publications from UCSF graduate students corresponding to Table 1. The time periods of graduation are indicated on the x axis (n =71 for 1979–1989 graduates; n = 104 for 2012–2014 graduates). The middle black lines indicate the mean, and the error bars show SDs. Data for graduation and publication times were rounded to the nearest quarter of a year in this graph. The P value differences (Kolmogorov–Smirnov test) between the two time periods for time to graduation, time to the first first-author publication, number of first-author publications, and number of first- and second-author publications are 0.0007, 0.0002, 0.0009, and 0.0083.
Fig. S4.
Fig. S4.
Scatter plot of data of (A) time to graduation, (B) time to the first first-author publication from entering graduate school, (C) number of first-author publications, and (D) number of first- and second-author publications from the top one-third UCSF graduate student group with the best publication record corresponding to Table 1. The time periods of graduation are indicated on the x axis (n =24 for 1979–1989 graduates; n = 34 for 2012–2014 graduates). The middle black lines indicate the mean, and the error bars show SDs. Data for graduation and publication times were rounded to the nearest quarter of a year in this graph. The P value differences (Kolmogorov–Smirnov test) between the two time periods for time to graduation, time to first first-author publication, number of first-author publications, and number of first- and second-author publications are 0.03, 0.002, 0.022, and 0.289.
Fig. 2.
Fig. 2.
Cumulative article (PDF) views and Tweets for the original version of this Perspective after its posting on bioRxiv (33). The data show the viewership and social media exchanges from the time of its posting (July 11, 2015) until the time when two peer reviews and a favorable editorial decision were transmitted to the author by PNAS (August, 21, 2015). Abstract views were more than twice the number of the PDF views. Data were provided by bioRxiv.

References

    1. Bertuzzi S, Drubin DG. No shortcuts for research assessment. Mol Biol Cell. 2013;24(10):1505–1506. - PMC - PubMed
    1. Alberts B, Kirschner MW, Tilghman S, Varmus H. Rescuing US biomedical research from its systemic flaws. Proc Natl Acad Sci USA. 2014;111(16):5773–5777. - PMC - PubMed
    1. Raff M, Johnson A, Walter P. Painful publishing. Science. 2008;321(5885):36. - PubMed
    1. Snyder SH. Science interminable: Blame Ben? Proc Natl Acad Sci USA. 2013;110(7):2428–2429. - PMC - PubMed
    1. National Institutes of Health Advisory Committee to the Director . Biomedical Research Workforce Working Group Report. National Institutes of Health; Bethesda: 2012.

MeSH terms