. 2015 Dec;169(4):2832-47.
doi: 10.1104/pp.15.01152. Epub 2015 Oct 27.

Nitrate-Dependent Control of Shoot K Homeostasis by the Nitrate Transporter1/Peptide Transporter Family Member NPF7.3/NRT1.5 and the Stelar K+ Outward Rectifier SKOR in Arabidopsis

Affiliations

Nitrate-Dependent Control of Shoot K Homeostasis by the Nitrate Transporter1/Peptide Transporter Family Member NPF7.3/NRT1.5 and the Stelar K+ Outward Rectifier SKOR in Arabidopsis

Navina Drechsler et al. Plant Physiol. 2015 Dec.

Abstract

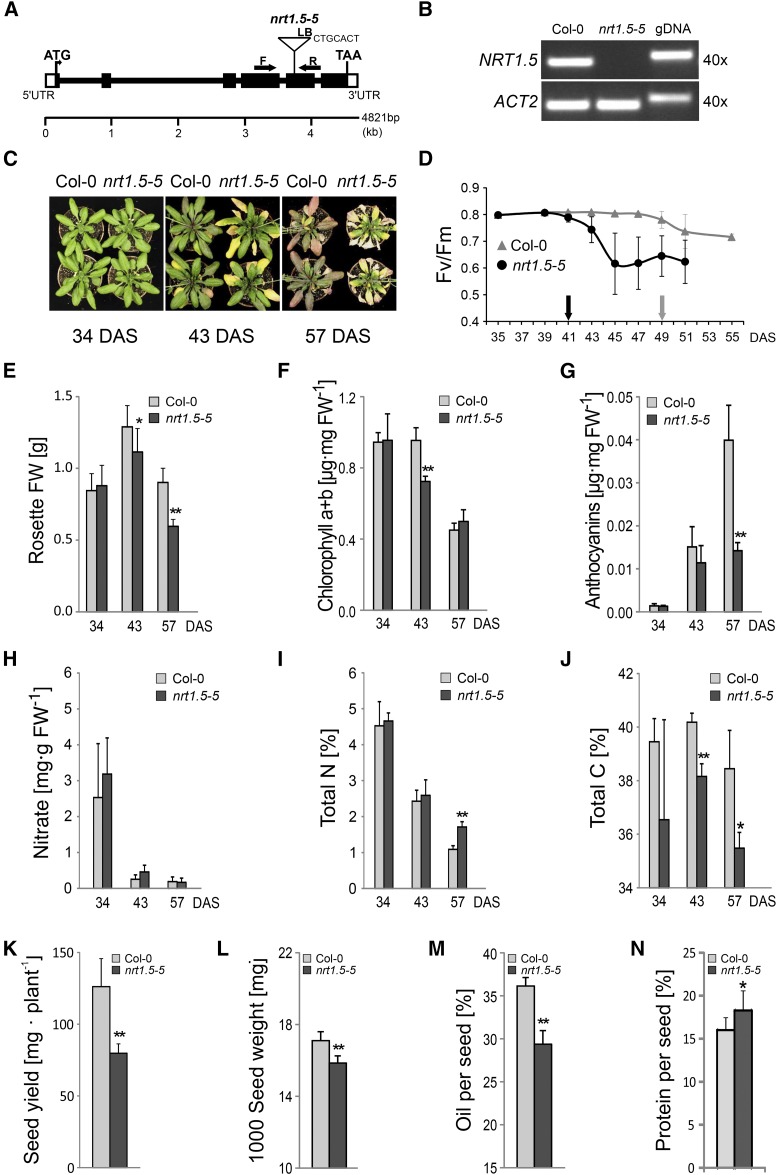
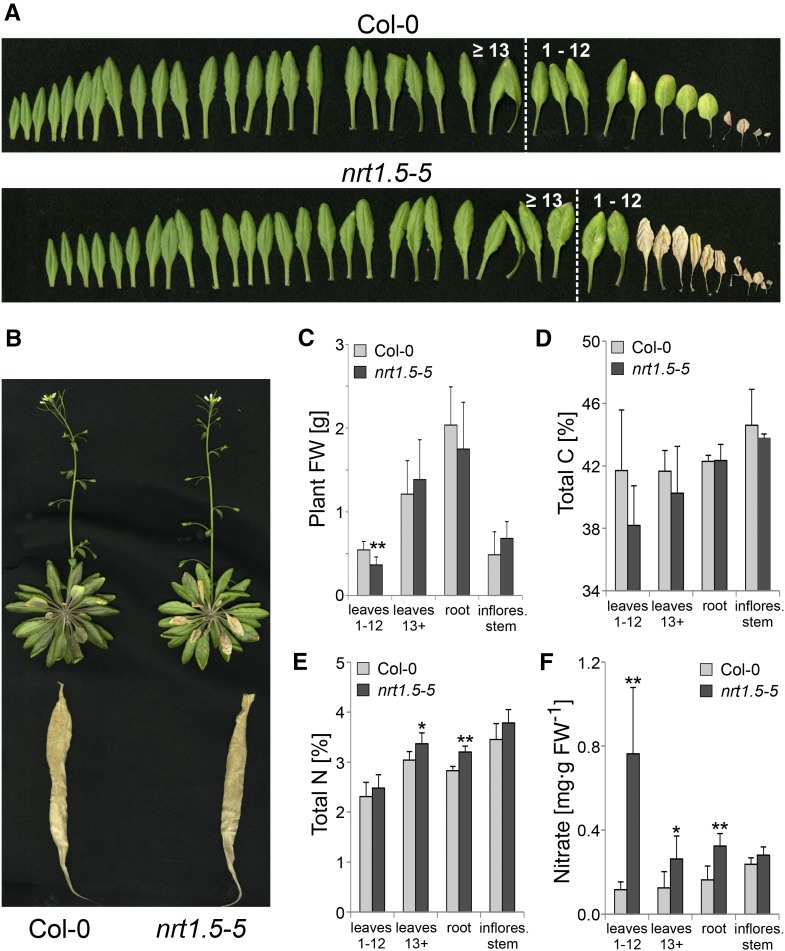
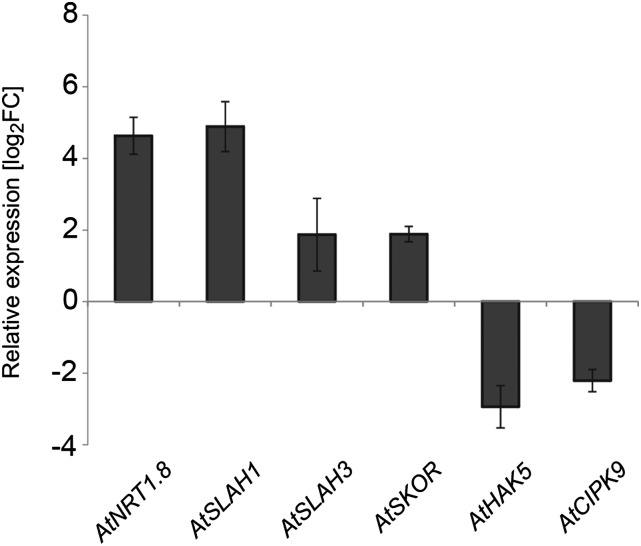
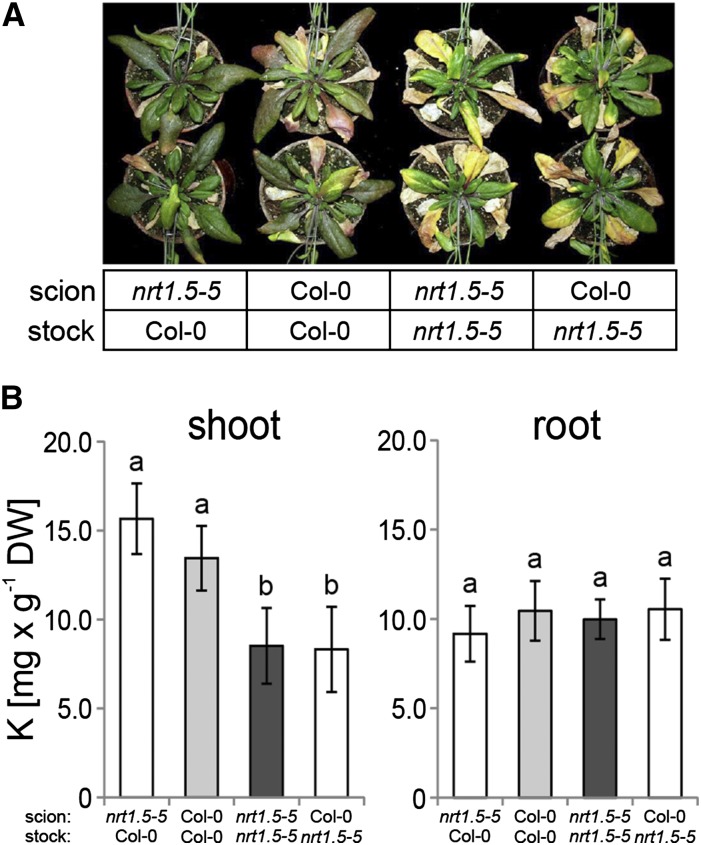
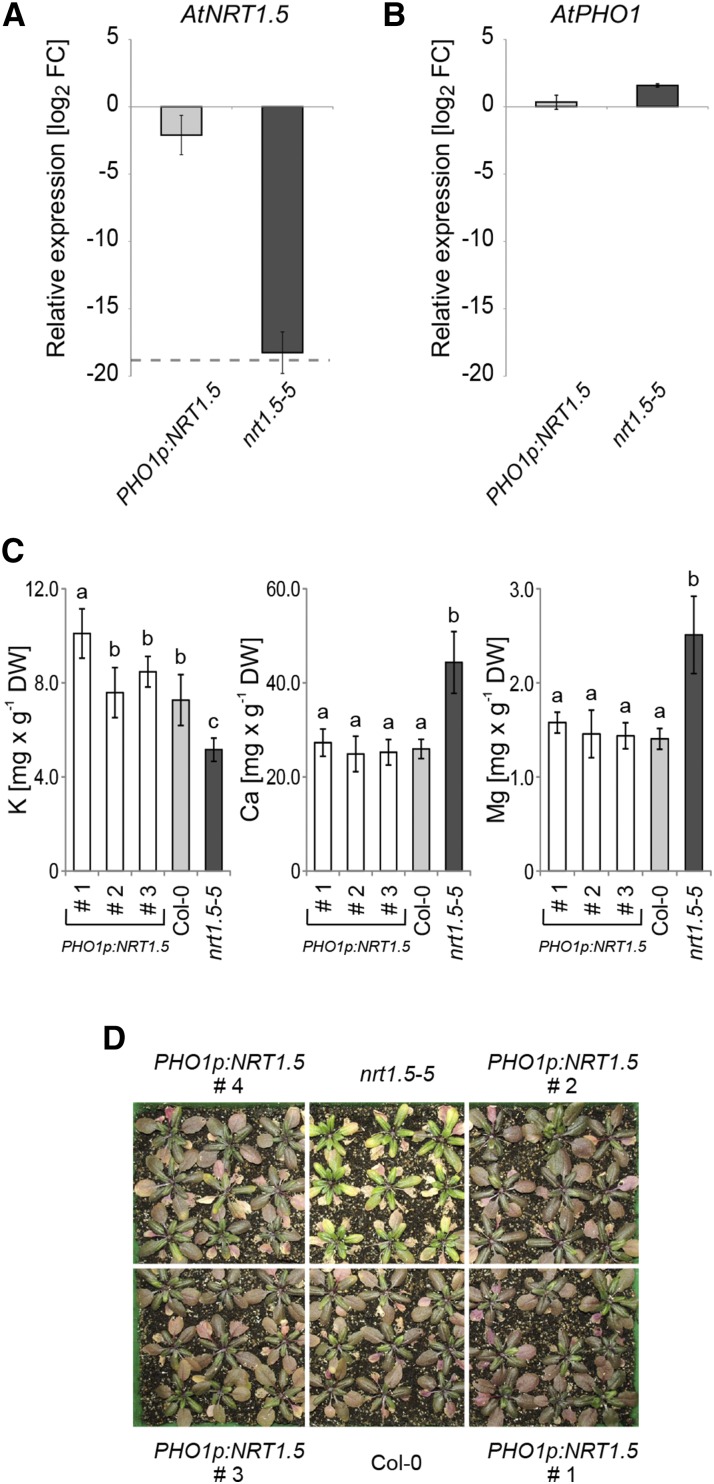
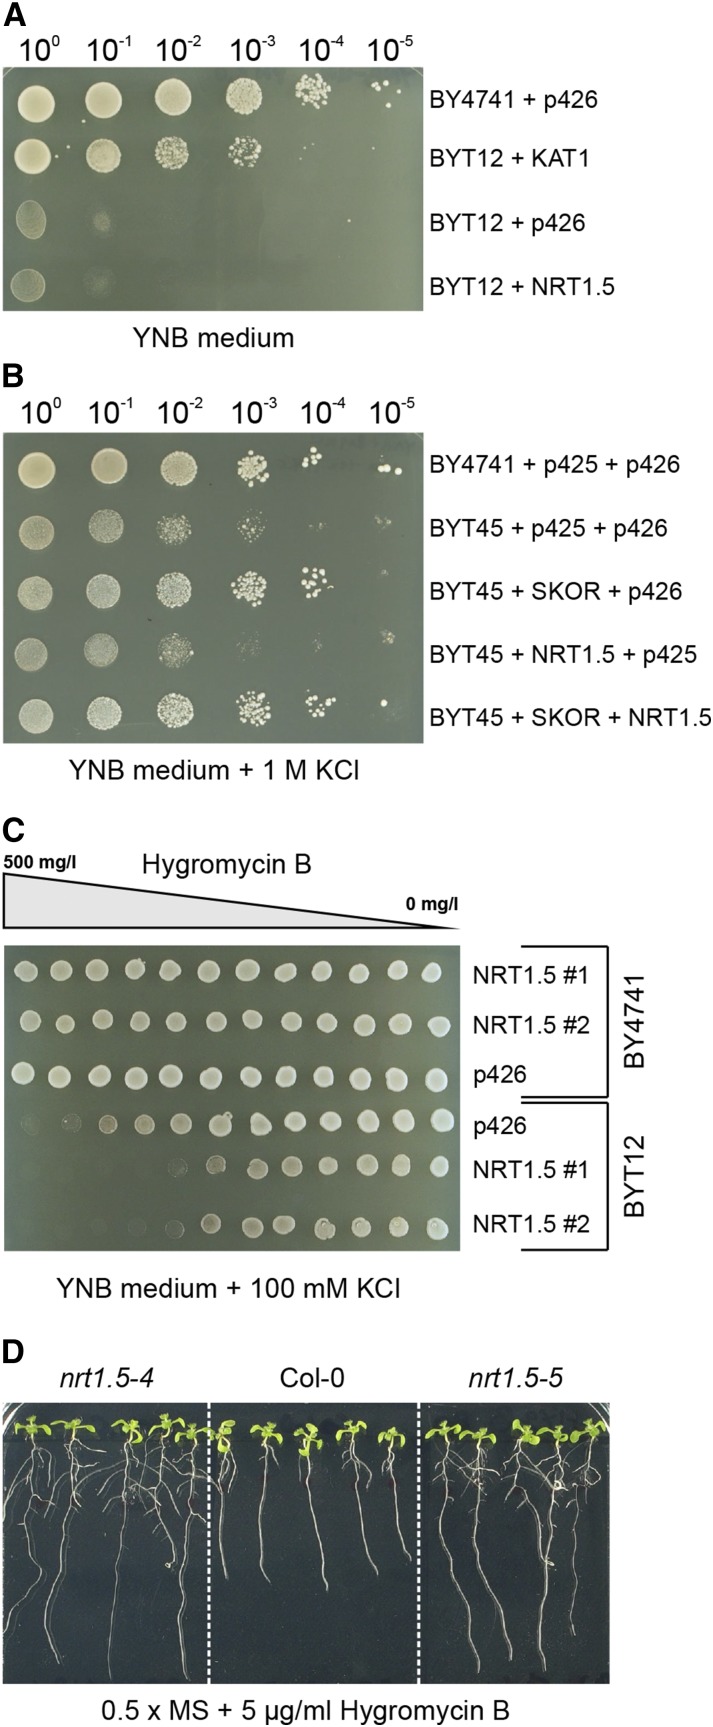
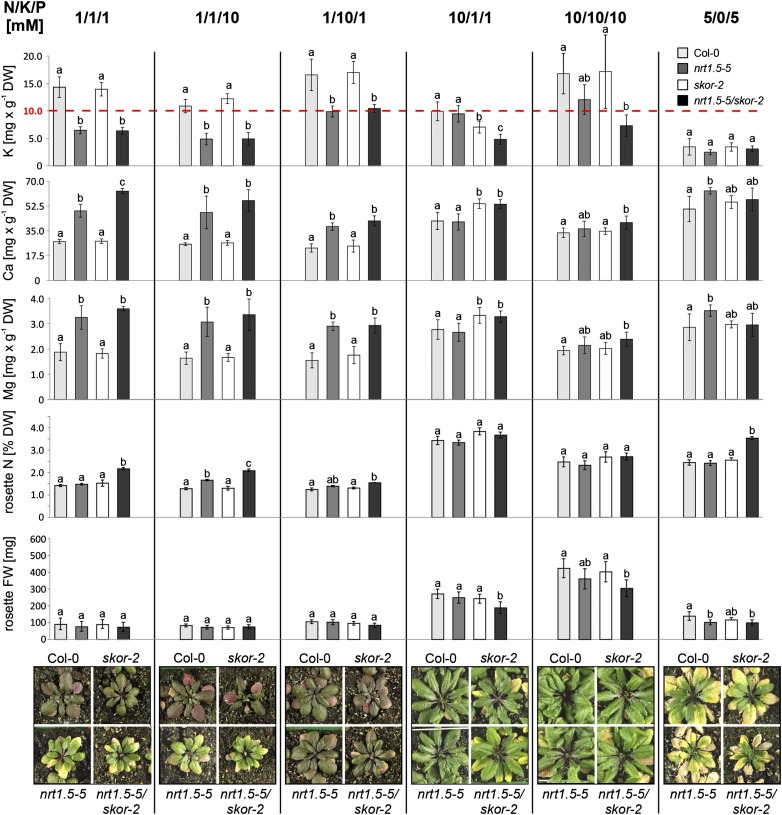
Root-to-shoot translocation and shoot homeostasis of potassium (K) determine nutrient balance, growth, and stress tolerance of vascular plants. To maintain the cation-anion balance, xylem loading of K(+) in the roots relies on the concomitant loading of counteranions, like nitrate (NO3 (-)). However, the coregulation of these loading steps is unclear. Here, we show that the bidirectional, low-affinity Nitrate Transporter1 (NRT1)/Peptide Transporter (PTR) family member NPF7.3/NRT1.5 is important for the NO3 (-)-dependent K(+) translocation in Arabidopsis (Arabidopsis thaliana). Lack of NPF7.3/NRT1.5 resulted in K deficiency in shoots under low NO3 (-) nutrition, whereas the root elemental composition was unchanged. Gene expression data corroborated K deficiency in the nrt1.5-5 shoot, whereas the root responded with a differential expression of genes involved in cation-anion balance. A grafting experiment confirmed that the presence of NPF7.3/NRT1.5 in the root is a prerequisite for proper root-to-shoot translocation of K(+) under low NO3 (-) supply. Because the depolarization-activated Stelar K(+) Outward Rectifier (SKOR) has previously been described as a major contributor for root-to-shoot translocation of K(+) in Arabidopsis, we addressed the hypothesis that NPF7.3/NRT1.5-mediated NO3 (-) translocation might affect xylem loading and root-to-shoot K(+) translocation through SKOR. Indeed, growth of nrt1.5-5 and skor-2 single and double mutants under different K/NO3 (-) regimes revealed that both proteins contribute to K(+) translocation from root to shoot. SKOR activity dominates under high NO3 (-) and low K(+) supply, whereas NPF7.3/NRT1.5 is required under low NO3 (-) availability. This study unravels nutritional conditions as a critical factor for the joint activity of SKOR and NPF7.3/NRT1.5 for shoot K homeostasis.


Figures

Figure 1.
Figure 1.
Pleiotropic phenotype of the T-DNA insertion mutant nrt1.5-5 on low-fertilized soil. A, NRT1.5 gene structure and T-DNA insertion site of the mutant line nrt1.5-5. LB, Left border. White boxes indicate untranslated regions (UTRs), and black boxes indicate exons. Arrows indicate positions of PCR primers used in B. B, RT-PCR analysis of NRT1.5 transcripts in rosette leaves of wild-type (Col-0) and homozygous nrt1.5-5 mutant plants. RT-PCR of ACTIN2 (ACT2; At3g18780) and PCR on genomic DNA (gDNA) served as controls. PCR cycle count was 40. C, Early leaf senescence phenotype of nrt1.5-5 on low-fertilized soil. Growth responses of Col-0 and nrt1.5-5 plants at 34, 43, and 57 DAS are shown. In three repeats of the experiment, plants developed the same phenotype. D, PSII maximum quantum efficiency decline in leaf number 8. Black and gray arrows indicate first declines in Fv/Fm in nrt1.5-5 and Col-0 plants, respectively, indicating senescence initiation (means ± sd; n = 8). E, Rosette fresh weight (FW) of Col-0 and nrt1.5-5 at 34, 43, and 57 DAS (means ± sd; n = 8). F, Chlorophyll content decreases at 43 DAS in nrt1.5-5 whole rosettes but not in Col-0 (means ± sd; n = 3). G, Reduced anthocyanin accumulation in nrt1.5-5 leaves (means ± sd; n = 3). H, Nitrate content in rosettes (means ± sd; n ≥ 5), I, Total N content in rosettes (means ± sd; n ≥ 4). J, Total C content in rosettes (means ± sd; n ≥ 4). K, Quantification of seed yield (means ± sd; n = 8). L, Thousand-seed weight (means ± sd; n = 8). M, Seed oil content (means ± sd; n = 8). N, Seed protein content (means ± sd; n = 8). Similar results were obtained in two independent experiments. *, Significant differences (Student’s t test) between nrt1.5-5 and Col-0 with P < 0.05; **, significant differences (Student’s t test) between nrt1.5-5 and Col-0 with P < 0.01.
Figure 2.
Figure 2.
NO3 limitation-induced nrt1.5-5 phenotype in hydroponic culture. A, Individual rosette leaves of Col-0 and nrt1.5-5 plants grown for 5 weeks in hydroponic culture with 0.1 mm NH4NO3 in the medium. Left to right shows young (nos. ≥13) to old (nos. 1–12) leaves. B, Representative picture of Col-0 and nrt1.5-5 plants at the time of harvest showing the root, the abaxial side of the rosette, and the inflorescence stem. C, Fresh weight (FW) of harvested plant material used for further analyses: pooled old leaves numbers 1 to 12, pooled young leaves numbers ≥13, roots, and inflorescence stems (means ± sd; n ≥ 9). D, Total C content in said plant material (means ± sd; n ≥ 4). E, Total N content in said plant material (means ± sd; n ≥ 4). F, NO3 concentration in said plant material (means ± sd; n ≥ 5). *, Significant differences (Student’s t test) between nrt1.5-5 and Col-0 with P < 0.05; **, significant differences (Student’s t test) between nrt1.5-5 and Col-0 with P < 0.01.
Figure 3.
Figure 3.
Differentially regulated genes in roots of nrt1.5-5 plants. Relative transcript levels of six regulated genes in roots of hydroponically grown plants were measured by qPCR and normalized to UBQ10 (means ± sd; n = 4). Plotted are the log2 fold expression changes (FCs) in nrt1.5-5 roots compared with Col-0 roots.
Figure 4.
Figure 4.
Rosette phenotype and K concentrations in shoots and roots of grafted Arabidopsis plants. A, Early leaf senescence phenotype as a result of the grafts as indicated in lower. Grafted plants were grown for 6 weeks on unfertilized type 0 soil supplemented for the first 2 weeks with 10 mm KNO3 to support plant growth and subsequently, 1 mm KNO3 to trigger development of the phenotype. B, K concentrations in shoots and roots of grafted plants. Data are means ± sd (n ≥ 6). The data were statistically analyzed by one-way ANOVA and subsequent multiple comparisons (Tukey’s range test). Different letters indicate a significant difference at P < 0.05. Vertical bars denote sds. DW, Dry weight.
Figure 5.
Figure 5.
Complementation of the nrt1.5-5 mutant. A, Relative NRT1.5 transcript levels in seedling roots of PHO1p:NRT1.5-transformed and -nontransformed nrt1.5-5 plants compared with NRT1.5 transcript levels in Col-0 plants. PHO1 promoter-driven expression of NRT1.5 recovers almost wild-type transcript level in the nrt1.5-5 mutant background. The NRT1.5 signal in nontransformed nrt1.5-5 plants is at background noise level (gray dashed line). B, Relative PHO1 transcript levels in seedling roots of PHO1p:NRT1.5-transformed and -nontransformed nrt1.5-5 plants compared with PHO1 transcript levels in Col-0 plants. PHO1 promoter-driven expression of NRT1.5 does not alter the PHO1 transcript level in the nrt1.5-5 mutant background. Seedlings in A and B were raised in one-half-strength MS liquid culture. Relative transcript levels in A and B were measured by qPCR and normalized to UBQ10. Plotted are the log2 fold expression changes (FCs) compared with Col-0 seedling roots. Values are means ± sd of n = 6 independent transgenic PHO1p:NRT1.5 lines (including lines 1–4 shown in C and D) with eight pooled plants per sample and n = 3 nrt1.5-5 samples with eight pooled plants per sample. C, Potassium, Ca, and Mg concentrations (means ± sd; n = 9) in rosettes of Col-0, nrt1.5-5, and three independent PHO1p:NRT1.5-transformed nrt1.5-5 lines (1–3) grown on unfertilized type 0 soil and supplemented with a one-half-strength MS-based fertilization solution containing 1:1:10 mm N:K:P (Supplemental Table S2). The data were statistically analyzed by one-way ANOVA and subsequent multiple comparisons (Tukey’s honestly significant difference mean-separation test). In samples marked with different letters, concentrations differ significantly at P < 0.05. D, Rosette phenotype of nrt1.5-5, Col-0, and four independent PHO1p:NRT1.5-transformed nrt1.5-5 lines grown under the same condition as in C. DW, Dry weight.
Figure 6.
Figure 6.
Functional analysis of NRT1.5. A, Potassium uptake capacity was analyzed in yeast BY4741 and the potassium import mutant strain BYT12 (trk1Δ trk2Δ) and transformed with the expression constructs indicated on the right; 20-µL cell suspensions (OD600 from 1.0 to 10−5) were dropped on YNB (-Ura) agar plates containing 7 mm K+, which is growth limiting for BYT12 cells. p426 is the empty vector. KAT1 and NRT1.5 are coding sequences of the respective Arabidopsis genes cloned in p426. B, Potassium export capacity was analyzed in yeast BY4741 and the potassium export mutant strain BYT45 (ena1-5Δ nha1Δ) cells and transformed with the expression constructs indicated on the right; 20-µL cell suspensions (OD600 from 1.0 to 10−5) were dropped on YNB (-Ura -Leu) agar plates supplemented with 1 m KCl, which is growth suppressing for BYT45 cells. p425 and p426 are empty vectors; SKOR and NRT1.5 are coding sequences of the respective Arabidopsis genes cloned in p425 and p426, respectively. C, HygB sensitivity of yeast BY4741 and BYT12 cells transformed with the expression constructs indicated on the right on YNB (-Ura) agar plates containing 100 mm KCl to support growth of BYT12 and an HygB concentration gradient from 0 to 0.5 g L−1. Twelve 3-µL drops of each yeast cell suspension (OD600 = 1.0) were distributed along the HygB gradient on the plate; 1 and 2 indicate two independent yeast transformants. Representative pictures of three independent experiments are shown. D, Root sensitivity test of nrt1.5 mutants and Col-0 on HygB-containing medium. Seedlings pregerminated for 4 d on one-half-strength MS were transferred on one-half-strength MS containing 5 mg L−1 HygB and continued to grow vertically for 7 more d.
Figure 7.
Figure 7.
Correlation of the rosette phenotype with the K, Ca, and Mg elemental composition in response to varying N, K, and P supply in Col-0, nrt1.5-5, skor-2, and nrt1.5-5/skor-2 plants. Each column shows the applied fertilization regime (N to K to P [mm]) along the top. The bar diagrams show the rosette K, Ca, Mg, and total N concentrations and fresh weight (FW) gain, respectively. On the bottom, the respective phenotypes of the plants are shown. The color codes of the bars are indicated in the top right corner. The dotted red line indicates a K concentration of 1% in the dry matter. The data were statistically analyzed by one-way ANOVA and subsequent multiple comparisons (Tukey’s honestly significant difference mean-separation test). Means (n ≥ 4) marked with different letters differ significantly at P < 0.05. Vertical bars denote sds. The experiment was performed three times independently with similar phenotypic growth responses. The elemental analysis by ICP-OES was performed for two of three independent experiments with similar results. DW, Dry weight.

References

    1. Anderson JA, Huprikar SS, Kochian LV, Lucas WJ, Gaber RF (1992) Functional expression of a probable Arabidopsis thaliana potassium channel in Saccharomyces cerevisiae. Proc Natl Acad Sci USA 89: 3736–3740 - PMC - PubMed
    1. Armengaud P, Breitling R, Amtmann A (2004) The potassium-dependent transcriptome of Arabidopsis reveals a prominent role of jasmonic acid in nutrient signaling. Plant Physiol 136: 2556–2576 - PMC - PubMed
    1. Bainbridge K, Bennett T, Turnbull C, Leyser O (2006) Grafting. Methods Mol Biol 323: 39–44 - PubMed
    1. Barbier-Brygoo H, De Angeli A, Filleur S, Frachisse JM, Gambale F, Thomine S, Wege S (2011) Anion channels/transporters in plants: from molecular bases to regulatory networks. Annu Rev Plant Biol 62: 25–51 - PubMed
    1. Barneix AJ, Breteler H (1985) Effect of cations on uptake, translocation and reduction of nitrate in wheat seedlings. New Phytol 99: 367–379

Publication types

MeSH terms