. 2015 Oct 14:10:2193-202.
doi: 10.2147/COPD.S86059. eCollection 2015.

A new approach to assess COPD by identifying lung function break-points

Affiliations

A new approach to assess COPD by identifying lung function break-points

Göran Eriksson et al. Int J Chron Obstruct Pulmon Dis. .

Abstract

Purpose: COPD is a progressive disease, which can take different routes, leading to great heterogeneity. The aim of the post-hoc analysis reported here was to perform continuous analyses of advanced lung function measurements, using linear and nonlinear regressions.

Patients and methods: Fifty-one COPD patients with mild to very severe disease (Global Initiative for Chronic Obstructive Lung Disease [GOLD] Stages I-IV) and 41 healthy smokers were investigated post-bronchodilation by flow-volume spirometry, body plethysmography, diffusion capacity testing, and impulse oscillometry. The relationship between COPD severity, based on forced expiratory volume in 1 second (FEV1), and different lung function parameters was analyzed by flexible nonparametric method, linear regression, and segmented linear regression with break-points.

Results: Most lung function parameters were nonlinear in relation to spirometric severity. Parameters related to volume (residual volume, functional residual capacity, total lung capacity, diffusion capacity [diffusion capacity of the lung for carbon monoxide], diffusion capacity of the lung for carbon monoxide/alveolar volume) and reactance (reactance area and reactance at 5Hz) were segmented with break-points at 60%-70% of FEV1. FEV1/forced vital capacity (FVC) and resonance frequency had break-points around 80% of FEV1, while many resistance parameters had break-points below 40%. The slopes in percent predicted differed; resistance at 5 Hz minus resistance at 20 Hz had a linear slope change of -5.3 per unit FEV1, while residual volume had no slope change above and -3.3 change per unit FEV1 below its break-point of 61%.

Conclusion: Continuous analyses of different lung function parameters over the spirometric COPD severity range gave valuable information additional to categorical analyses. Parameters related to volume, diffusion capacity, and reactance showed break-points around 65% of FEV1, indicating that air trapping starts to dominate in moderate COPD (FEV1 =50%-80%). This may have an impact on the patient's management plan and selection of patients and/or outcomes in clinical research.

Keywords: body plethysmography; break-point; impulse oscillometry; severity; single-breath carbon-monoxide diffusion test; spirometry.


Figures

Figure 1
Figure 1
A descriptive example of the segmented linear regression (SLR) relationship between forced expiratory volume in 1 second (FEV1) percent of predicted (%pred) and FEV1/forced vital capacity (FVC), showing an estimated break-point at 80% of FEV1 when the FEV1/FVC ratio is close to 0.70. Notes: The solid line to the left (SLR-L) and the hatched line to the right (SLR-R) of the break-point are the segmented linear fits which join at the break-point, estimated at the top of the figure (circles with the associated 95% confidence intervals). An ordinary linear regression (LR) line (hatched gray) and the reference, a nonparametric fit by the local regression (LOESS) method (gray line), are also displayed. Dots show the values of each healthy smoker and COPD patient. The Global Initiative for Chronic Obstructive Lung Disease (GOLD) stages and the obstructive FEV1/FVC ratio of 0.70 are also shown.
Figure 2
Figure 2
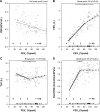
The relationship between spirometric severity (forced expiratory volume in 1 second [FEV1] percent of predicted [%pred]) and selected lung function parameters: (A) resistance at 20 Hz (R20), (B) FEV1, (C) total lung capacity (TLC), and (D) diffusion capacity of the lung for carbon monoxide (DLCO)/alveolar volume (VA). Notes: Figures are arranged by P-values for the segmented test (from no P-value in A to P<0.001 in D). The lower the P-value, the better the segmented linear regression (SLR) curve fitting aligned to local regression (LOESS) compared to the linear regression (LR) curve fitting. The black solid line to the left (SLR-L) and the black hatched line to the right (SLR-R) of the break-point are the segmented linear fits which join at the break-point, estimated at the top of the figure (circles with the associated 95% confidence intervals). An ordinary LR line (hatched gray) and the reference, a nonparametric fit by the LOESS method (solid gray), are also displayed. Dots show the values of each healthy smoker and COPD patient. Bolded letters between lines indicate Global Initiative for Chronic Obstructive Lung Disease (GOLD) stage and healthy smokers (HS).
Figure 3
Figure 3
The relationship between spirometric severity (forced expiratory volume in 1 second [FEV1] percent of predicted [%pred]) and selected lung function parameters with break-points in the range of 60–70 FEV1%pred. Total lung capacity (TLC) %pred (A), functional residual capacity (FRC) %pred (B), RVbp%pred (C), RVbp-RVCO %pred (D), diffusion capacity of the lung for carbon monoxide (DLCO)/alveolar volume (VA) %pred (E), and reactance area (AX) (F) all had break-points in the middle of Global Initiative for Chronic Obstructive Lung Disease (GOLD) Stage II. Notes: The black solid line to the left (SLR-L) and the black hatched line to the right (SLR-R) of the break-point are the segmented linear fits which join at the break-point, estimated in the top of the figure (circles with the associated 95% confidence intervals). An ordinary linear regression (LR) line (hatched gray) and the reference, a nonparametric fit by the local regression (LOESS) method (solid gray), are also displayed. Dots show the values of each healthy smoker and COPD patient. Bolded letters between lines indicate GOLD stages and healthy smokers (HS). Abbreviations: RVbp, Residual Volume measured with bodypletysmograph; RVCO, RV measured by CO.
Figure 4
Figure 4
Descriptive presentation of lung function parameters expressed as percent of predicted (%pred) in relation to forced expiratory volume in 1 second (FEV1) %pred for healthy smokers and COPD patients. (A) Preferred linear regression (LR) lines and (B) segmented linear regression (SLR) lines. Note: The gray line shows an estimation of a slope of 1 at 100% predicted. Abbreviations: DLCO, diffusion capacity of the lung for carbon monoxide; FRC, functional residual capacity; FVC, forced vital capacity; IC, inspiratory capacity; R5, resistance at 5 Hz; R20, resistance at 20 Hz; Rtot, total resistance; RVbp, Residual Volume measured with bodypletysmograph; RVCO, RV measured by CO; VA, alveolar volume; X5, reactance at 5 Hz.

References

    1. World Health Organization (WHO) The top 10 causes of death [web page on the Internet]. Fact sheet number 310. Geneva: WHO; [Accessed March 27, 2015]. nd [updated May 2014]. Available from: http://www.who.int/mediacentre/factsheets/fs310/en/
    1. Soriano JB, Rodriguez-Roisin R. Chronic obstructive pulmonary disease overview: epidemiology, risk factors, and clinical presentation. Proc Am Thorac Soc. 2011;8(4):363–367. - PubMed
    1. Rycroft CE, Heyes A, Lanza L, Becker K. Epidemiology of chronic obstructive pulmonary disease: a literature review. Int J Chron Obstruct Pulmon Dis. 2012;7:457–494. - PMC - PubMed
    1. Chung KF, Adcock IM. Multifaceted mechanisms in COPD: inflammation, immunity, and tissue repair and destruction. Eur Respir J. 2008;31(6):1334–1356. - PubMed
    1. Sohal SS, Ward C, Danial W, Wood-Baker R, Walters EH. Recent advances in understanding inflammation and remodeling in the airways in chronic obstructive pulmonary disease. Expert Rev Respir Med. 2013;7(3):275–288. - PubMed

MeSH terms