. 2016 Oct;76(4):1047-58.
doi: 10.1002/mrm.26005. Epub 2015 Oct 28.

Bloch-Siegert B1+-mapping for human cardiac (31) P-MRS at 7 Tesla

Affiliations

Bloch-Siegert B1+-mapping for human cardiac (31) P-MRS at 7 Tesla

William T Clarke et al. Magn Reson Med. 2016 Oct.

Abstract

Purpose: Phosphorus MR spectroscopy ((31) P-MRS) is a powerful tool for investigating tissue energetics in vivo. Cardiac (31) P-MRS is typically performed using surface coils that create an inhomogeneous excitation field across the myocardium. Accurate measurements of B1+ (and hence flip angle) are necessary for quantitative analysis of (31) P-MR spectra. We demonstrate a Bloch-Siegert B1+-mapping method for this purpose.

Theory and methods: We compare acquisition strategies for Bloch-Siegert B1+-mapping when there are several spectral peaks. We optimize a Bloch-Siegert sensitizing (Fermi) pulse for cardiac (31) P-MRS at 7 Tesla (T) and apply it in a three-dimensional (3D) chemical shift imaging sequence. We validate this in phantoms and skeletal muscle (against a dual-TR method) and present the first cardiac (31) P B1+-maps at 7T.

Results: The Bloch-Siegert method correlates strongly (Pearson's r = 0.90 and 0.84) and has bias <25 Hz compared with a multi-TR method in phantoms and dual-TR method in muscle. Cardiac 3D B1+-maps were measured in five normal volunteers. B1+ maps based on phosphocreatine and alpha-adenosine-triphosphate correlated strongly (r = 0.62), confirming that the method is T1 insensitive.

Conclusion: The 3D (31) P Bloch-Siegert B1+-mapping is consistent with reference methods in phantoms and skeletal muscle. It is the first method appropriate for (31) P B1+-mapping in the human heart at 7T. Magn Reson Med 76:1047-1058, 2016. © 2015 The Authors. Magnetic Resonance in Medicine published by Wiley Periodicals, Inc. on behalf of International Society for Magnetic Resonance in Medicine. This is an open access article under the terms of the Creative Commons Attribution License, which permits use, distribution and reproduction in any medium, provided the original work is properly cited.

Keywords: 31P-MRS; 7T; B1+-mapping; Bloch-Siegert; cardiac; heart; phosphorus; spectroscopy.


Figures

Figure 1
Figure 1
a: Pulse sequence timing diagram for a Bloch‐Siegert spectroscopy B1+‐mapping sequence. The Bloch‐Siegert sensitizing pulse is inserted between the excitation pulse and the readout module. In this work, the readout module consists of 3D phase encoding gradients, acquisition of a free induction decay, spoiler gradients and a final delay to produce the desired TR. The sequence is adapted from that in Figure 1 of reference 21. b: Illustration of the real part of 31P spectra acquired for each of the measurement strategies detailed in the Theory Section and corresponding to a row in Table 1. The peaks used for analysis in each case are shown in blue. The position of the Bloch‐Siegert pulses are shown by red arrows. The phase accumulated by each peak is proportional to the inverse of its frequency offset from the Bloch‐Siegert pulse (Eq. (1)). Note that when the Bloch‐Siegert pulse is placed at ‐2 kHz, the β‐ATP peak is almost entirely saturated.
Figure 2
Figure 2
Precision and accuracy of the single‐peak acquisition strategies [Method A (blue line) and Method B′ (red line)] computed from the analytical expressions in Table 1. A numerical Bloch simulation of both methods, with the optimized Fermi pulse, is shown for comparison (dashed lines). Note that the differences apparent in the Bloch simulations in panel (a) and (b) arise due to direct excitation and correspond to the oscillations in B1+ fractional error in Figure 4c. The magnitude of the bias introduced scales with the simulation γB1+ (277Hz). The standard deviation calculated analytically is not affected by direct excitation. a: The fractional error, as defined by Eq. (4) of the simulated mean from the true γB1+ (277Hz) as a function of Fermi pulse offset from the central frequency ωRF. b: The fractional error from γB1,true+ as a function of γB1,peak+. c,d: Standard deviation of γB1+, ΔγB1+ as a function of pulse offset and γB1,peak+.
Figure 3
Figure 3
Fractional B1+ error (Eq. (4)), “Bias”, and standard deviation, “Precision”, of the multipeak acquisition strategies for a two peak spectrum. a: Method B″. b: Method C. The error and standard deviation are plotted as functions of the individual peak offsets from the Bloch‐Siegert sensitizing pulse, ω1and ω2; and as the second peak position ω2 (with ω1 fixed at 2 kHz) and γB1,peak+. The calculations do not take into account any direct excitation caused by the Bloch‐Siegert sensitizing (Fermi) pulse, therefore, the optimum separation will be a compromise between minimizing excitation and minimizing error and standard deviation. Method C (multipeak single‐acquisition) shows a 2 improvement over Method A when the Bloch‐Siegert pulse can be placed symmetrically between the peaks. Method C has worse performance than Method B″ if the peaks are on the same side of the Bloch‐Siegert pulse, while Method B″ is independent of the sign of ωi.
Figure 4
Figure 4
a: Example Fermi pulse envelopes, with fixed duration TP=3.5 ms, but varying the shaping parameters T0 and a. b: Bloch simulation of five Fermi pulses showing the transverse magnetisation immediately after the pulse. γB1+ = 1000 Hz. The orange line 1 is the pulse chosen for the experimental section of this work. c: Percentage error in calculation of γB1+ as a result of the direct excitation caused by the Fermi pulse. d: Percentage deviation of the transverse magnetisation from 0 as defined by Eq. (7) for a 3.5‐ms Fermi pulse as a function of the shaping parameters T0 and a. The “x” mark the locations of the pulses used to generate the lines in panels a–c.
Figure 5
Figure 5
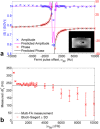
a: Fitted phase (red “x”) and amplitude (blue “x”) of a single peak in the presence of a Fermi pulse, as a function of Fermi‐pulse offset. The amplitude shows saturation as the narrow passband of the Fermi pulse overlaps the single phosphate peak. The phase closely follows the phase predicted by Eq. (2) using a separate B1+ measurement (solid black). The measured amplitudes are closely approximated by a Bloch simulation of the pulse sequence (magenta). The inset shows a transverse 1H image of the phantom, comprising a small cube of phosphate suspended in a tank of brine. b: γB1+ calculated using the pairs of symmetric offsets from the same experiment. The values calculated by the Bloch‐Siegert method match those from a nonlocalized multi‐flip‐angle method in the range 500–4000 Hz.
Figure 6
Figure 6
a: Bloch‐Siegert B1+maps, overlaid on 1H localizer images, across four central slices of the 16 × 8 × 8 CSI grid of the uniform phantom. Each rectangle indicates the measured value in a single ideal voxel. The maps are masked for CRLBϕ, phase wrap and by the limits of the phantom. b: Scatter plot of the per‐voxel fitted multi‐TR validation method against the value measured by the Bloch‐Siegert method. The color indicates the CRLBϕ on the fitted phase difference and Pearson's correlation coefficient r = 0.90. c: Bland‐Altman plot (average of two methods versus difference) of the validation and Bloch‐Siegert methods. The color indicates the CRLBϕ on the fitted phase difference and lines show the mean difference and the ±95% confidence intervals.
Figure 7
Figure 7
a: Bloch‐Siegert B1+ map from a central slice of an 16 × 8 × 8 CSI grid in a transverse plane of a healthy volunteer's quadriceps. The map is overlaid on a 1H localizer registered to the CSI grid. b,c: Example magnitude and real spectra from a central voxel in a. The maps in a are calculated from the phase of the PCr peak. The phase difference between the PCr peak of the spectrum with a 2 kHz offset (blue) on the Fermi pulse and the ‐2 kHz offset (red) is 55.6° corresponding to a value of γB1+ = 484 Hz.
Figure 8
Figure 8
a: Bloch‐Siegert B1+ maps from slices of an 16 × 8 × 8 CSI grid in a mid‐short axis plane of five healthy volunteer subjects. The maps are overlaid on 1H localizers registered to the CSI grid. b,c: Example magnitude and real spectra from a mid‐interventricular septal voxel, marked by a black “x” in the lowest B1+ map in a. The maps in a are calculated from the phase of the PCr peak. The phase difference between the PCr peak of the spectrum with a 2 kHz offset (blue) on the Fermi pulse and the ‐2 kHz offset (red) is 86.9° corresponding to a value of γB1+ = 605 Hz.
Figure 9
Figure 9
a: Three volunteer comparison of consecutive Bloch‐Siegert B1+ maps, collected with the Fermi pulse placed symmetrically around the PCr peak and then subsequently the α‐ATP peak in three of the subjects in the study. b: Bland‐Altman plot of the metabolite comparison. The means and 95% confidence intervals are calculated from all points shown.

References

    1. Bottomley PA. NMR spectroscopy of the human heart In: Harris RK, Wasylishen RE, editors. Encylcopedia of magnetic resonance. Chichester: John Wiley; 2009.
    1. Neubauer S. Mechanisms of disease ‐ the failing heart ‐ an engine out of fuel. N Engl J Med 2007;356:1140–1151. - PubMed
    1. Hudsmith LE, Neubauer S. Detection of myocardial disorders by magnetic resonance spectroscopy. Nat Clin Pract Card 2008;5:S49–S56. - PubMed
    1. Neubauer S, Horn M, Cramer M, et al. Myocardial phosphocreatine‐to‐ATP ratio is a predictor of mortality in patients with dilated cardiomyopathy. Circulation 1997;96:2190–2196. - PubMed
    1. Stoll V, Clarke WT, Levelt E, Myerson SG, Robson MD, Neubauer S, Rodgers CT. 7T versus 3T phosphorus magnetic resonance spectroscopy in patients with dilated cardiomyopathy. J Cardiovasc Magn Reson 2015;17(Suppl. 1):249.

Publication types

MeSH terms