

Toward Atomistic Resolution Structure of Phosphatidylcholine Headgroup and Glycerol Backbone at Different Ambient Conditions
- PMID: 26509669
- PMCID: PMC4677354
- DOI: 10.1021/acs.jpcb.5b04878
Toward Atomistic Resolution Structure of Phosphatidylcholine Headgroup and Glycerol Backbone at Different Ambient Conditions
Abstract
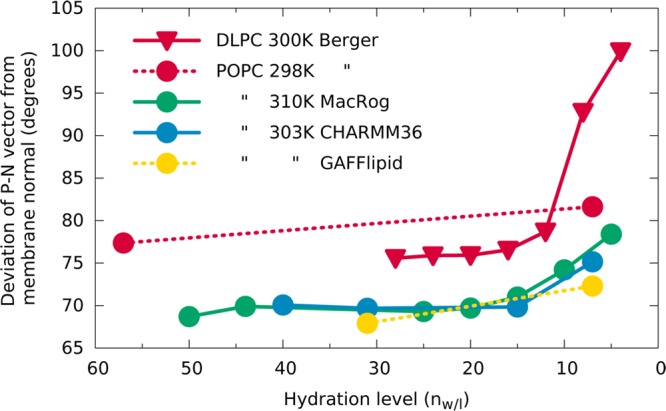
Phospholipids are essential building blocks of biological membranes. Despite a vast amount of very accurate experimental data, the atomistic resolution structures sampled by the glycerol backbone and choline headgroup in phoshatidylcholine bilayers are not known. Atomistic resolution molecular dynamics simulations have the potential to resolve the structures, and to give an arrestingly intuitive interpretation of the experimental data, but only if the simulations reproduce the data within experimental accuracy. In the present work, we simulated phosphatidylcholine (PC) lipid bilayers with 13 different atomistic models, and compared simulations with NMR experiments in terms of the highly structurally sensitive C-H bond vector order parameters. Focusing on the glycerol backbone and choline headgroups, we showed that the order parameter comparison can be used to judge the atomistic resolution structural accuracy of the models. Accurate models, in turn, allow molecular dynamics simulations to be used as an interpretation tool that translates these NMR data into a dynamic three-dimensional representation of biomolecules in biologically relevant conditions. In addition to lipid bilayers in fully hydrated conditions, we reviewed previous experimental data for dehydrated bilayers and cholesterol-containing bilayers, and interpreted them with simulations. Although none of the existing models reached experimental accuracy, by critically comparing them we were able to distill relevant chemical information: (1) increase of choline order parameters indicates the P-N vector tilting more parallel to the membrane, and (2) cholesterol induces only minor changes to the PC (glycerol backbone) structure. This work has been done as a fully open collaboration, using nmrlipids.blogspot.fi as a communication platform; all the scientific contributions were made publicly on this blog. During the open research process, the repository holding our simulation trajectories and files ( https://zenodo.org/collection/user-nmrlipids ) has become the most extensive publicly available collection of molecular dynamics simulation trajectories of lipid bilayers.
Figures


Similar articles
-
Atomistic resolution structure and dynamics of lipid bilayers in simulations and experiments.Biochim Biophys Acta. 2016 Oct;1858(10):2512-2528. doi: 10.1016/j.bbamem.2016.01.019. Epub 2016 Jan 22. Biochim Biophys Acta. 2016. PMID: 26809025 Review.
-
Molecular electrometer and binding of cations to phospholipid bilayers.Phys Chem Chem Phys. 2016 Nov 30;18(47):32560-32569. doi: 10.1039/c6cp04883h. Phys Chem Chem Phys. 2016. PMID: 27874109
-
Solid-State NMR Validation of OPLS4: Structure of PC-Lipid Bilayers and Its Modulation by Dehydration.J Phys Chem B. 2024 Dec 19;128(50):12483-12492. doi: 10.1021/acs.jpcb.4c04719. Epub 2024 Dec 9. J Phys Chem B. 2024. PMID: 39651780 Free PMC article.
-
Headgroup Structure and Cation Binding in Phosphatidylserine Lipid Bilayers.J Phys Chem B. 2019 Oct 31;123(43):9066-9079. doi: 10.1021/acs.jpcb.9b06091. Epub 2019 Oct 21. J Phys Chem B. 2019. PMID: 31574222
-
Structure and dynamics of phospholipids in membranes elucidated by combined use of NMR and vibrational spectroscopies.Biochim Biophys Acta Biomembr. 2020 Sep 1;1862(9):183352. doi: 10.1016/j.bbamem.2020.183352. Epub 2020 May 11. Biochim Biophys Acta Biomembr. 2020. PMID: 32407775 Review.
Cited by
-
Effect of magnesium sulfate in oxidized lipid bilayers properties by using molecular dynamics.Biochem Biophys Rep. 2021 Apr 28;26:100998. doi: 10.1016/j.bbrep.2021.100998. eCollection 2021 Jul. Biochem Biophys Rep. 2021. PMID: 33997315 Free PMC article.
-
Conditions for the stable adsorption of lipid monolayers to solid surfaces.PNAS Nexus. 2023 Jun 7;2(6):pgad190. doi: 10.1093/pnasnexus/pgad190. eCollection 2023 Jun. PNAS Nexus. 2023. PMID: 37383024 Free PMC article.
-
High-performance macromolecular data delivery and visualization for the web.Acta Crystallogr D Struct Biol. 2020 Dec 1;76(Pt 12):1167-1173. doi: 10.1107/S2059798320014515. Epub 2020 Nov 26. Acta Crystallogr D Struct Biol. 2020. PMID: 33263322 Free PMC article.
-
Rotational decoupling between the hydrophilic and hydrophobic regions in lipid membranes.Biophys J. 2022 Jan 4;121(1):68-78. doi: 10.1016/j.bpj.2021.12.003. Epub 2021 Dec 11. Biophys J. 2022. PMID: 34902330 Free PMC article.
-
Effects of Coarse Graining and Saturation of Hydrocarbon Chains on Structure and Dynamics of Simulated Lipid Molecules.Sci Rep. 2017 Sep 13;7(1):11476. doi: 10.1038/s41598-017-11761-5. Sci Rep. 2017. PMID: 28904383 Free PMC article.
References
-
- Structure and Dynamics of Membranes; Lipowsky R., Sackmann E., Eds.; Elsevier: New York, 1995.
-
- Klauda J. B.; Venable R. M.; MacKerell A. D. Jr.; Pastor R. W. In Computational Modeling of Membrane Bilayers; Feller S. E., Ed.; Current Topics in Membranes; Academic Press: New York, 2008; Vol. 60; pp 1–48.
-
- Edholm O. In Computational Modeling of Membrane Bilayers; Feller S. E., Ed.; Current Topics in Membranes; Academic Press: New York, 2008; Vol. 60; pp 91–110.
-
- Tieleman D. P. In Molecular Simulations and Biomembranes: From Biophysics to Function; Sansom M., Biggin P., Eds.; The Royal Society of Chemistry: London, 2010; pp 1–25.
Publication types
MeSH terms
Substances
LinkOut - more resources
Full Text Sources
Other Literature Sources
