The Effect of Neutral Peritoneal Dialysis Solution with Low Glucose-Degradation-Product on the Fluid Status and Body Composition--A Randomized Control Trial
- PMID: 26510186
- PMCID: PMC4625015
- DOI: 10.1371/journal.pone.0141425
The Effect of Neutral Peritoneal Dialysis Solution with Low Glucose-Degradation-Product on the Fluid Status and Body Composition--A Randomized Control Trial
Abstract
Background: Previous studies report conflicting results on the benefit of peritoneal dialysis (PD) patients treated with low glucose degradation product (GDP) solution. The effects of low GDP solution on body fluid status and arterial pulse wave velocity (PWV) have not been studied.
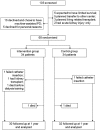
Methods: We randomly assigned 68 incident PD patients to low GDP (Intervention Group) or conventional solutions (Control Group); 4 dropped off before they received the assigned treatment. Patients were followed for 52 weeks for changes in ultrafiltration, residual renal function, body fluid status and arterial PWV.
Result: After 52 weeks, Intervention Group had higher overhydration (3.1 ± 2.6 vs 1.9 ± 2.2 L, p = 0.045) and extracellular water volume (17.7 ± 3.9 vs 15.8 ± 3.1 L, p = 0.034) than Control Group. There was no significant difference in PWV between groups. There was no significant difference in residual renal function between the Groups. Intervention Group had lower ultrafiltration volume than Control Group at 4 weeks (0.45 ± .0.61 vs 0.90 ± 0.79 L/day, p = 0.013), but the difference became insignificant at later time points. Intervention Group had lower serum CRP levels than Control Group (4.17 ± 0.77 vs 4.91 ± 0.95 mg/dL, p < 0.0001).
Conclusion: Incident PD patients treated with low GDP solution have less severe systemic inflammation but trends of less ultrafiltration, and more fluid accumulation. However, the effects on ultrafiltration and fluid accumulation disappear with time. The long term effect of low GDP solution requires further study.
Trial registration: ClinicalTrials.gov NCT00966615.
Conflict of interest statement
Figures


References
-
- Davies SJ, Bryan J, Phillips L, Russell GI. Longitudinal changes in peritoneal kinetics: the effects of peritoneal dialysis and peritonitis. Nephrol Dial Transplant 1996; 11: 498–506. - PubMed
-
- Breborowicz A, Oreopoulos DG. Biocompatibility of peritoneal dialysis solutions. Am J Kidney Dis 1996; 27: 738–743. - PubMed
-
- Liberek T, Topley N, Jorres A, Petersen MM, Coles GA, Gahl GM, et al. Peritoneal dialysis fluid inhibition of polymorphonuclear leucocyte respiratory burst activation is related to the lowering of intracellular pH. Nephrol 1993; 65: 260–265. - PubMed
-
- Cappelli G, Bandiani G, Cancarini GC, Feriani M, Dell'Aquila R, Saffioti S, et al. Low concentrations of glucose degradation products in peritoneal dialysis fluids and their impact on biocompatibility parameters: prospective cross-over study with a three-compartment bag. Adv Perit Dial 1999; 15: 238–242. - PubMed
-
- van Biesen W, Kirchgessner J, Schilling H, Lage C, Lambert MC, Passlick-Deetjen J. Stay-Safe®, a new PCV-free system for PD: results of the multicenter trial. Perit Dial Int 1999; 19(Suppl 1): S43.
Publication types
MeSH terms
Substances
Associated data
LinkOut - more resources
Full Text Sources
Other Literature Sources
Medical
Research Materials
Miscellaneous

