

. 2015 Oct;17 Suppl 4(Suppl 4):iv1-iv62.
doi: 10.1093/neuonc/nov189.
Epub 2015 Oct 27.
CBTRUS Statistical Report: Primary Brain and Central Nervous System Tumors Diagnosed in the United States in 2008-2012
Affiliations
- PMID: 26511214
- PMCID: PMC4623240
- DOI: 10.1093/neuonc/nov189
Item in Clipboard
CBTRUS Statistical Report: Primary Brain and Central Nervous System Tumors Diagnosed in the United States in 2008-2012
Neuro Oncol.
2015 Oct.
No abstract available
Figures

Schematic of Cancer Registration Process for CBTRUS Reporting.
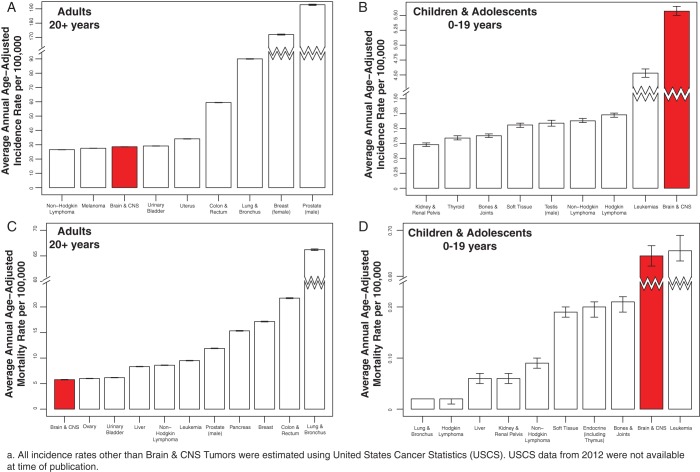
Average Annual Age-Adjusted Incidence Ratesa of All Primary Brain and CNS Tumors in Comparison to Other Common Cancers for A) Adults (Age 20+ years) and B) Children and Adolescents (Age 0-19 years) and Mortality Rates of All Primary Brain and CNS Tumors in Comparison to Other Common Cancers in C) Adults (Age 20+ years) and D) Children and Adolescents (Age 0-19 years), CBTRUS Statistical Report: NPCR and SEER 2008-2012, USCS 2008-2011b, NCVS 2008-2012.

Distributiona of Primary Brain and CNS Tumors by Behavior (N = 356,858), CBTRUS Statistical Report: NPCR and SEER, 2008-2012.

Average Annual Age-Adjusted Incidence Ratesa of Primary Brain and CNS Tumors by Age and Behavior, CBTRUS Statistical Report: NPCR and SEER, 2008-2012.

Annual Age-Adjusted Incidence Ratesa of Primary Brain and CNS Tumors by Year and Behavior, CBTRUS Statistical Report: NPCR and SEER, 2008-2012.

Percentage of All Primary Brain and CNS Tumors Histologically Confirmed and with Complete WHO Grade by Central Cancer Registry, CBTRUS Statistical Report: NPCR and SEER, 2011-2012.

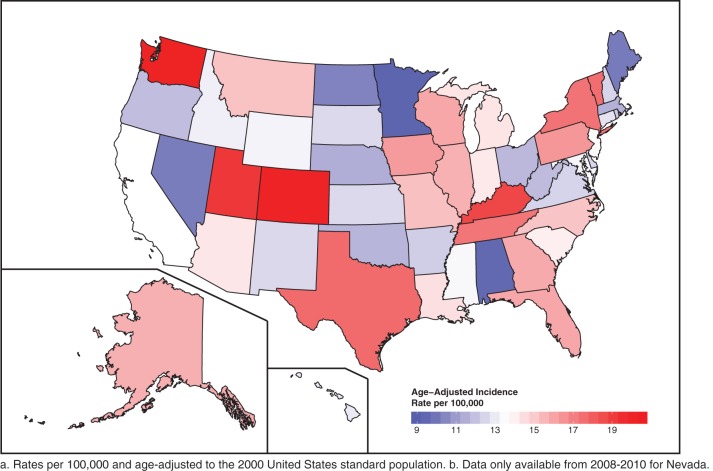
Average Annual Age-Adjusted Incidence Ratesa of All Primary Brain and CNS Tumors by Central Cancer Registry, CBTRUS Statistical Report: NPCR and SEER, 2008-2012b.

Average Annual Age-Adjusted Incidence Ratesa of Malignant Primary Brain and CNS Tumors by Central Cancer Registry, CBTRUS Statistical Report: NPCR and SEER, 2008-2012b.
Average Annual Age-Adjusted Incidence Ratesa of Non-Malignant Primary Brain and CNS Tumors by Central Cancer Registry, CBTRUS Statistical Report: NPCR and SEER, 2008-2012b.

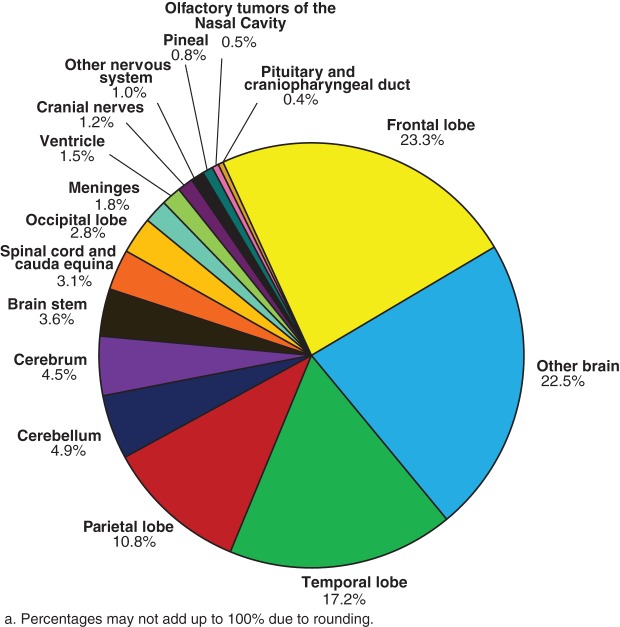
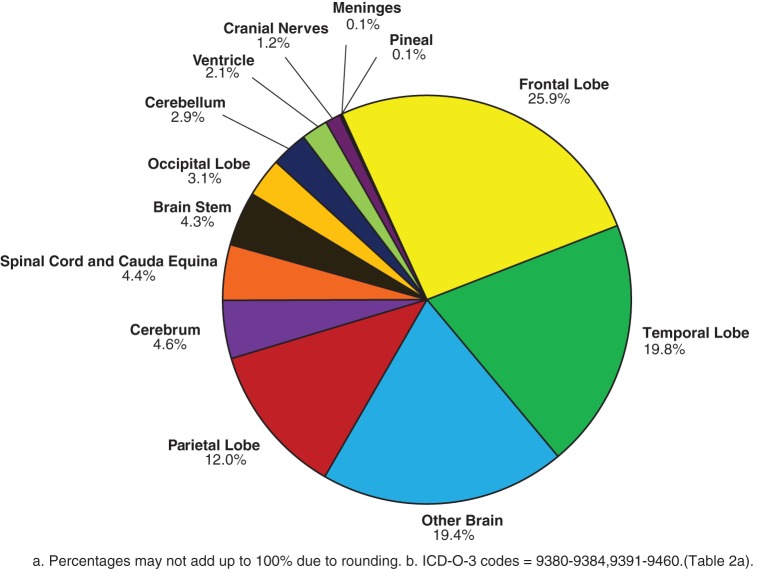
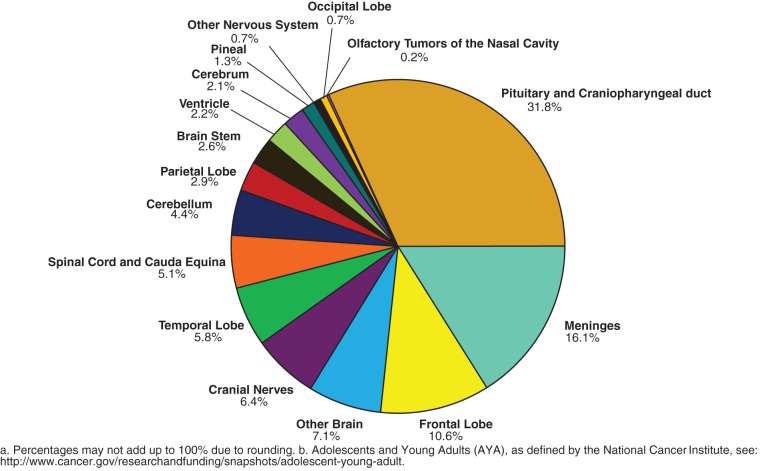
Distributiona of All Primary Brain and CNS Tumors by Site (N = 356,858), CBTRUS Statistical Report: NPCR and SEER, 2008-2012.
Distributiona of Malignant Primary Brain and CNS Tumors by Site (N = 117,023), CBTRUS Statistical Report: NPCR and SEER, 2008-2012.

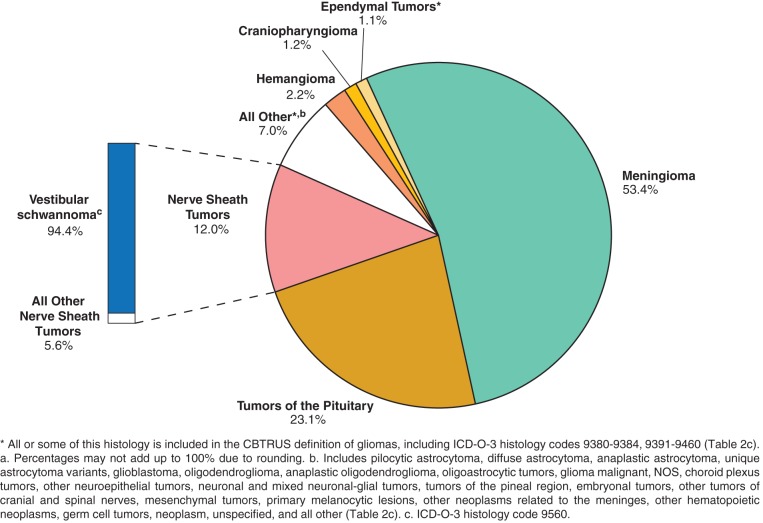
Distributiona of Non-Malignant Primary Brain and CNS Tumors by Site (N = 239,835), CBTRUS Statistical Report: NPCR and SEER, 2008-2012.
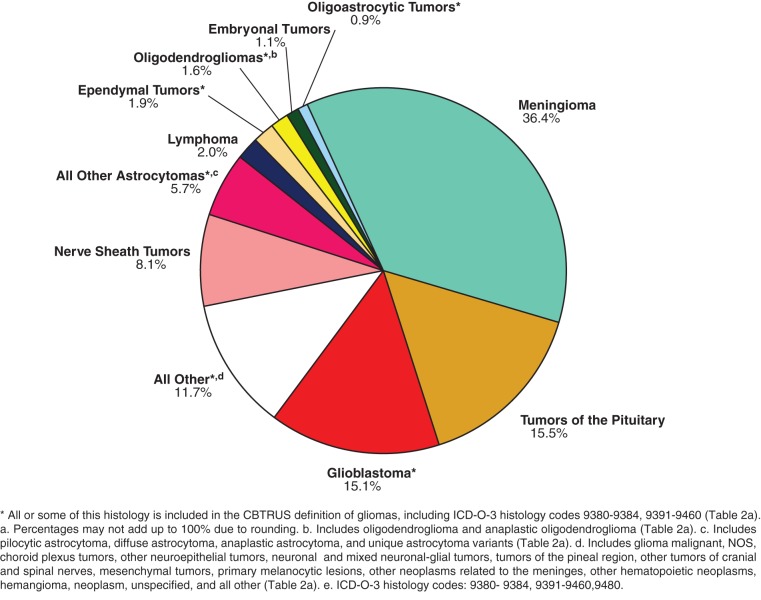
Distributiona of All Primary Brain and CNS Tumors by CBTRUS Histology Groupings and Histology (N = 356,858), CBTRUS Statistical Report: NPCR and SEER, 2008-2012.
Distributiona of Malignant Primary Brain and CNS Tumors by CBTRUS Histology Groupings and Histology (N = 117,023), CBTRUS Statistical Report: NPCR and SEER, 2008-2012.
Distributiona of Non-Malignant Primary Brain and CNS Tumors by CBTRUS Histology Groupings and Histology (N = 239,835), CBTRUS Statistical Report: NPCR and SEER, 2008-2012.
Distribution of Primary Brain and CNS Gliomasa by Site (N = 97,910), CBTRUS Statistical Report: NPCR and SEER, 2008-2012.

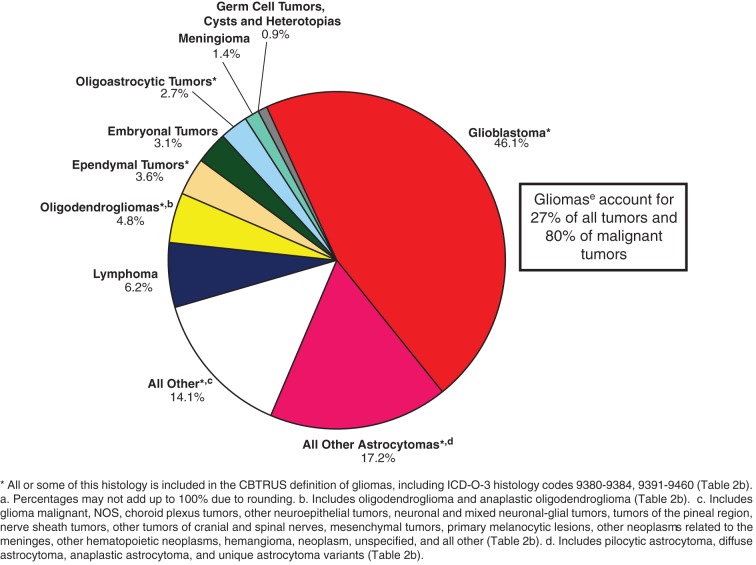
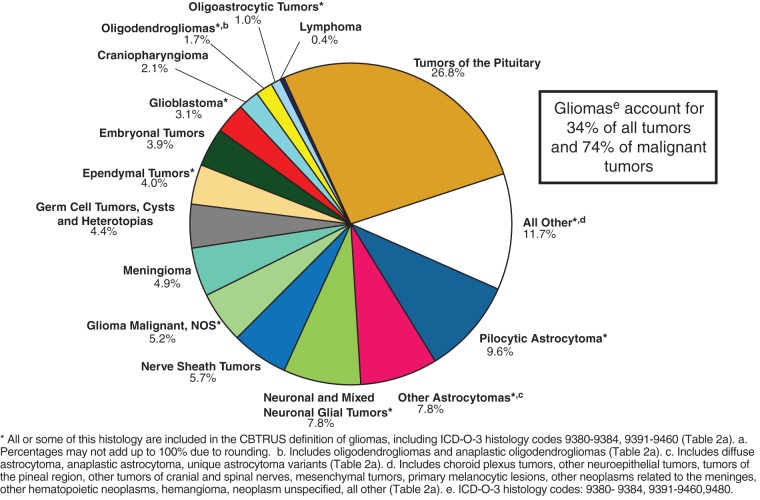
Distributiona of Primary Brain and CNS Gliomasb by Histology Subtypes (N = 97,910), CBTRUS Statistical Report: NPCR and SEER, 2008-2012.

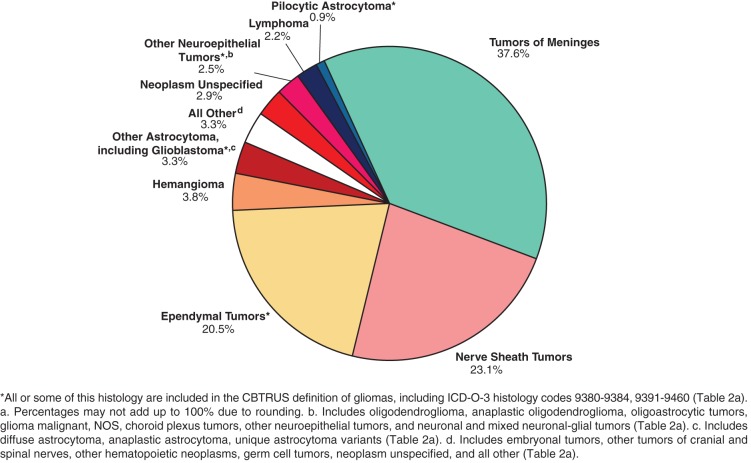
Distributiona of Spinal Cord, Spinal Meninges and Cauda Equina Tumors in Children and Adolescents (Age 0-19 years), CBTRUS Histology Groupings and Histology (N = 1,256), CBTRUS Statistical Report: NPCR and SEER, 2008-2012.
Distributiona of Spinal Cord, Spinal Meninges and Cauda Equina Tumors in Adults (Age 20+ years), CBTRUS Histology Groupings and Histology (N = 15,473), CBTRUS Statistical Report: NPCR and SEER, 2008-2012.
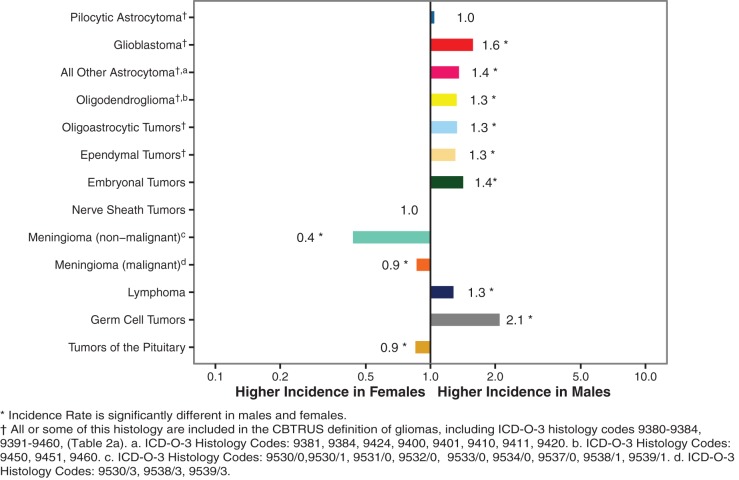
Incidence Rate Ratios by Gender (Males:Females) for Selected CBTRUS Histology Groupings and Histology, CBTRUS Statistical Report: NPCR and SEER, 2008-2012.
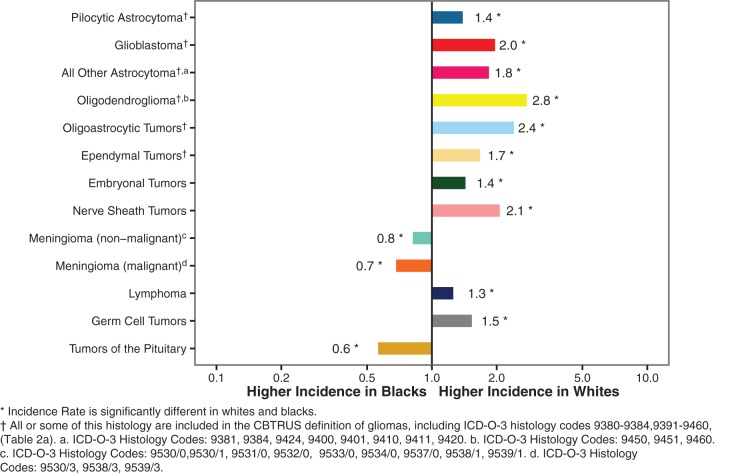
Incidence Rate Ratios by Race (Whites:Blacks) for Selected CBTRUS Histology Groupings and Histologies, CBTRUS Statistical Report: NPCR and SEER, 2008-2012.

Age-Adjusted Incidence Ratesa of Brain and CNS Tumors by Selected Histologies and Age Groups (Age 20+ years), CBTRUS Statistical Report: NPCR and SEER, 2008-2012.
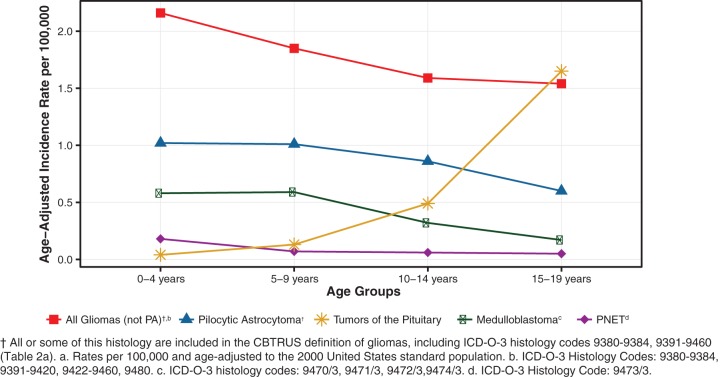
Age-Adjusted Incidence Ratesa in Children and Adolescents of Brain and CNS Tumors by Selected Histologies and Age Groups (Age 0-19 years), CBTRUS Statistical Report: NPCR and SEER, 2008-2012.

Distributiona in Children and Adolescents (Age 0-19 years) of Primary Brain and CNS Tumors by Site (N = 23,113), CBTRUS Statistical Report: NPCR and SEER, 2008-2012.

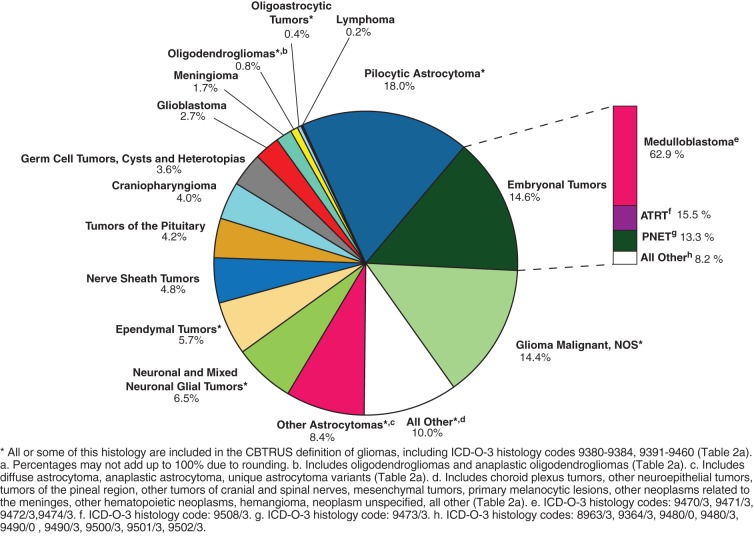
Distributiona in Children and Adolescents (Age 0-19 years) of Primary Brain and CNS Tumors by CBTRUS Histology Groupings and Histology (N = 23,113), CBTRUS Statistical Report: NPCR and SEER, 2008-2012.

Distributiona in Children (Age 0-14 years) of Primary Brain and CNS Tumors by Site (N = 16,366), CBTRUS Statistical Report: NPCR and SEER, 2008-2012.
Distributiona in Children (Age 0-14 years) of Primary Brain and CNS Tumors by CBTRUS Histology Groupings and Histology (N = 16,366), CBTRUS Statistical Report: NPCR and SEER, 2008-2012.

Distributiona in Adolescentsb (Age 15-19 years) of Primary Brain and CNS Tumors by Site (N = 6,747), CBTRUS Statistical Report: NPCR and SEER, 2008-2012.
Distributiona in Adolescents (Age 15-19 years) of Primary Brain and CNS Tumors by Histology (N = 6,747), CBTRUS Statistical Report: NPCR and SEER, 2008-2012.

Average Annual Age-Adjusted Mortality Ratesa for Malignant Primary Brain and CNS Tumors by Central Cancer Registry, CBTRUS Statistical Report: NCHS, 2008-2012.
Distributiona in Adolescents and Young Adultsb (Age 15-39 years) of Primary Brain and CNS Tumors by Site (N = 53,083), CBTRUS Statistical Report: NPCR and SEER, 2008-2012.

Distributiona in Adolescents and Young Adultsb (Age 15-39 years) of Primary Brain and CNS Tumors by Histology (N = 53,083), CBTRUS Statistical Report: NPCR and SEER, 2008-2012.
References
-
- Centers for Disease Control and Prevention (CDC). National Program of Cancer Registries Cancer Surveillance System Rationale and Approach. 1999; http://www.cdc.gov/cancer/npcr/pdf/npcr_css.pdf.
-
- Cancer Registries Amendment Act, 102nd Cong. § 515 (1992). http://www.gpo.gov/fdsys/pkg/STATUTE-106/pdf/STATUTE-106-Pg3372.pdf.
-
- Benign Brain Tumor Cancer Registries Amendment Act, 107th Cong. § 260 (2002). http://www.gpo.gov/fdsys/pkg/PLAW-107publ260/pdf/PLAW-107publ260.pdf.
-
- National Cancer Institute. Overview of the SEER Program. http://seer.cancer.gov/about/overview.html.
-
- Centers for Disease Control and Prevention National Center for Health Statistics. United States Cancer Statistics: 1999–2012 Incidence, WONDER Online Database. United States Department of Health and Human Services, Centers for Disease Control and Prevention and National Cancer Institute; 2015. Accessed at http://wonder.cdc.gov/cancer-v2012.html http://wonder.cdc.gov/ucd-icd10.html.
MeSH terms
LinkOut - more resources
Full Text Sources
Other Literature Sources
Medical
