

Identification of type 2 diabetes subgroups through topological analysis of patient similarity
- PMID: 26511511
- PMCID: PMC4780757
- DOI: 10.1126/scitranslmed.aaa9364
Identification of type 2 diabetes subgroups through topological analysis of patient similarity
Abstract
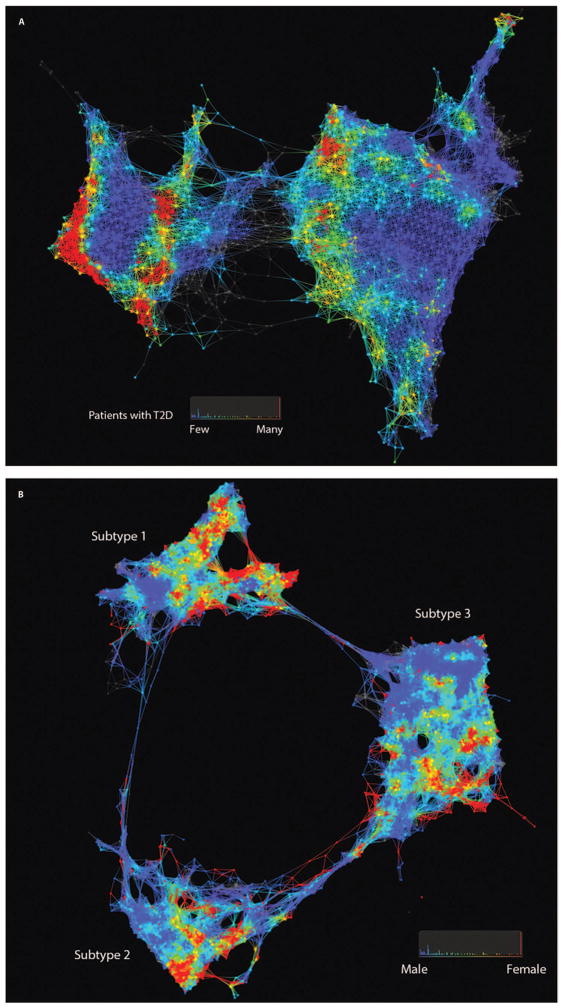
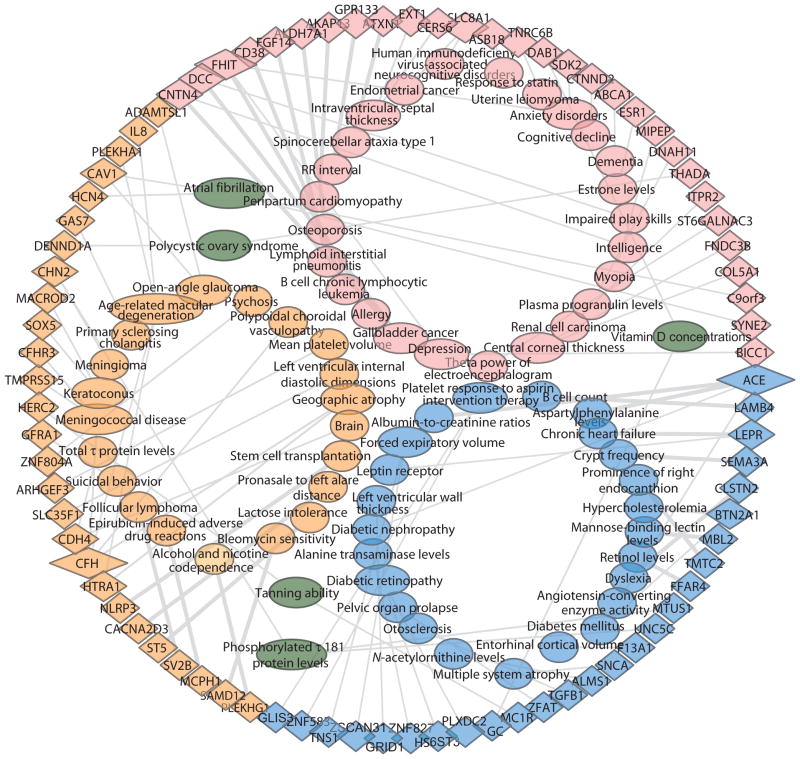
Type 2 diabetes (T2D) is a heterogeneous complex disease affecting more than 29 million Americans alone with a rising prevalence trending toward steady increases in the coming decades. Thus, there is a pressing clinical need to improve early prevention and clinical management of T2D and its complications. Clinicians have understood that patients who carry the T2D diagnosis have a variety of phenotypes and susceptibilities to diabetes-related complications. We used a precision medicine approach to characterize the complexity of T2D patient populations based on high-dimensional electronic medical records (EMRs) and genotype data from 11,210 individuals. We successfully identified three distinct subgroups of T2D from topology-based patient-patient networks. Subtype 1 was characterized by T2D complications diabetic nephropathy and diabetic retinopathy; subtype 2 was enriched for cancer malignancy and cardiovascular diseases; and subtype 3 was associated most strongly with cardiovascular diseases, neurological diseases, allergies, and HIV infections. We performed a genetic association analysis of the emergent T2D subtypes to identify subtype-specific genetic markers and identified 1279, 1227, and 1338 single-nucleotide polymorphisms (SNPs) that mapped to 425, 322, and 437 unique genes specific to subtypes 1, 2, and 3, respectively. By assessing the human disease-SNP association for each subtype, the enriched phenotypes and biological functions at the gene level for each subtype matched with the disease comorbidities and clinical differences that we identified through EMRs. Our approach demonstrates the utility of applying the precision medicine paradigm in T2D and the promise of extending the approach to the study of other complex, multifactorial diseases.
Copyright © 2015, American Association for the Advancement of Science.
Conflict of interest statement
Figures
Comment in
-
Precision medicine with electronic medical records: from the patients and for the patients.Ann Transl Med. 2016 Oct;4(Suppl 1):S61. doi: 10.21037/atm.2016.10.40. Ann Transl Med. 2016. PMID: 27868029 Free PMC article. No abstract available.
References
-
- Centers for Disease Control and Prevention. National Diabetes Statistics Report: Estimates of Diabetes and Its Burden in the United States, 2014. U.S. Department of Health and Human Services; Atlanta, GA: 2014.
-
- Fong DS, Aiello LP, Ferris FL, III, Klein R. Diabetic retinopathy. Diabetes Care. 2004;27:2540–2553. - PubMed
-
- Lehto S, Rönnemaa T, Pyörälä K, Laakso M. Predictors of stroke in middle-aged patients with non–insulin-dependent diabetes. Stroke. 1996;27:63–68. - PubMed
-
- Beckman JA, Creager MA, Libby P. Diabetes and atherosclerosis: Epidemiology, pathophysiology, and management. JAMA. 2002;287:2570–2581. - PubMed
Publication types
MeSH terms
Grants and funding
LinkOut - more resources
Full Text Sources
Other Literature Sources
Medical
