. 2015 Nov 10;112(45):E6166-74.
doi: 10.1073/pnas.1519384112. Epub 2015 Oct 28.

Basal autophagy maintains pancreatic acinar cell homeostasis and protein synthesis and prevents ER stress

Affiliations

Basal autophagy maintains pancreatic acinar cell homeostasis and protein synthesis and prevents ER stress

Laura Antonucci et al. Proc Natl Acad Sci U S A. .

Abstract

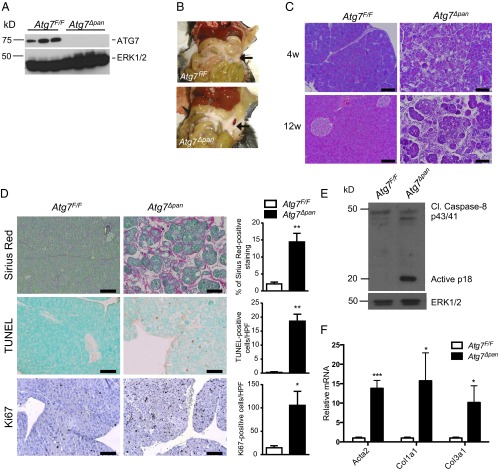
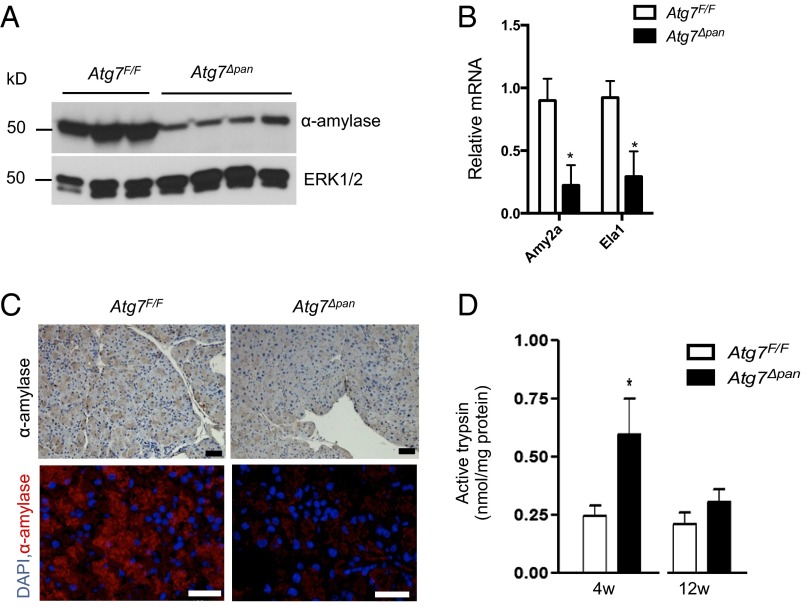
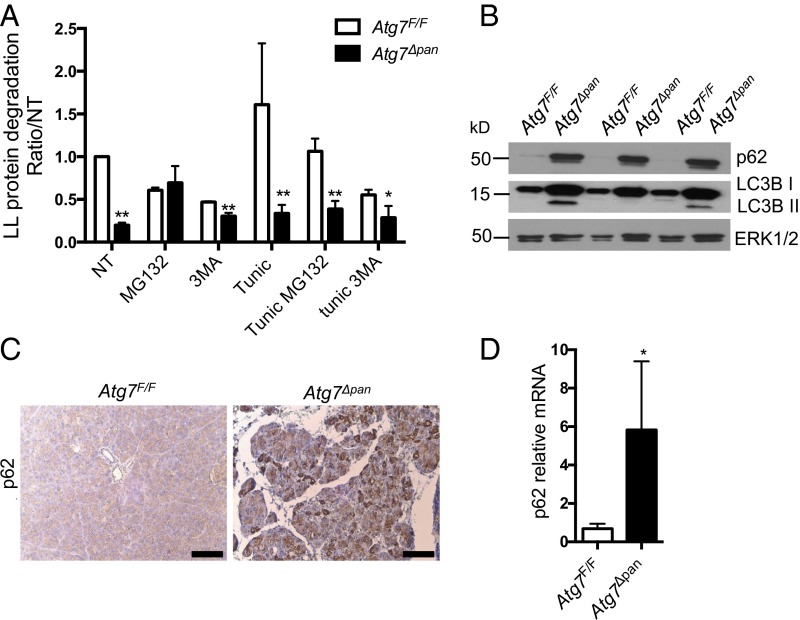
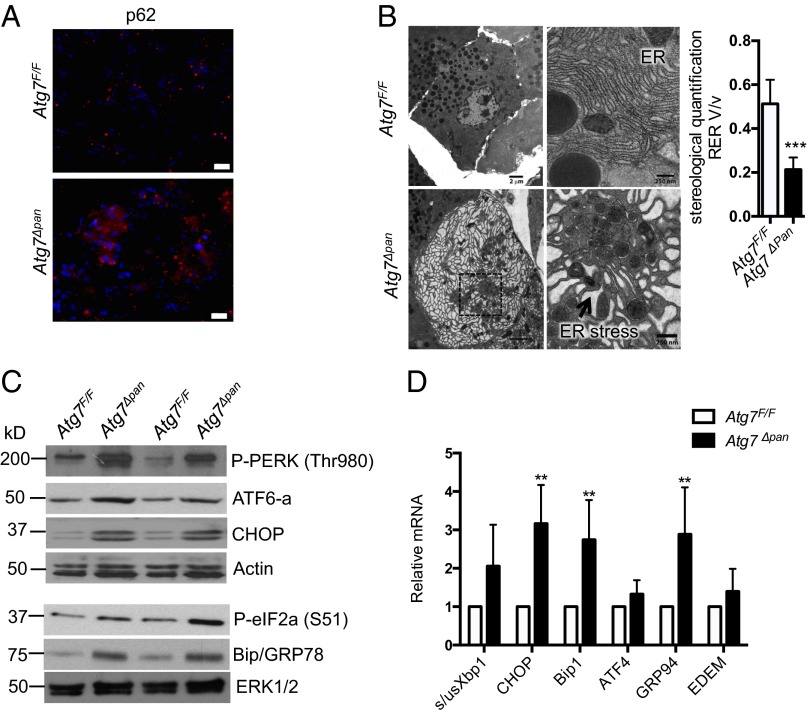
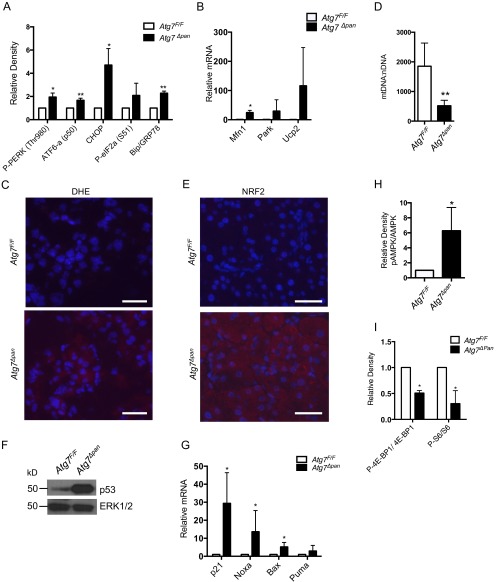
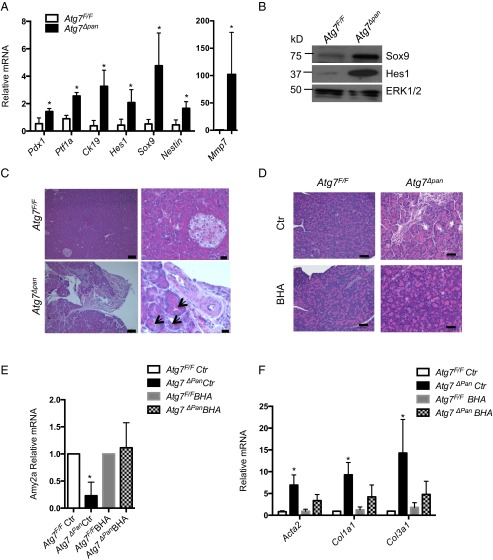
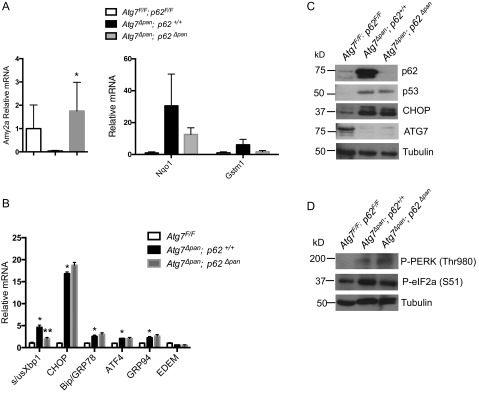
Pancreatic acinar cells possess very high protein synthetic rates as they need to produce and secrete large amounts of digestive enzymes. Acinar cell damage and dysfunction cause malnutrition and pancreatitis, and inflammation of the exocrine pancreas that promotes development of pancreatic ductal adenocarcinoma (PDAC), a deadly pancreatic neoplasm. The cellular and molecular mechanisms that maintain acinar cell function and whose dysregulation can lead to tissue damage and chronic pancreatitis are poorly understood. It was suggested that autophagy, the principal cellular degradative pathway, is impaired in pancreatitis, but it is unknown whether impaired autophagy is a cause or a consequence of pancreatitis. To address this question, we generated Atg7(Δpan) mice that lack the essential autophagy-related protein 7 (ATG7) in pancreatic epithelial cells. Atg7(Δpan) mice exhibit severe acinar cell degeneration, leading to pancreatic inflammation and extensive fibrosis. Whereas ATG7 loss leads to the expected decrease in autophagic flux, it also results in endoplasmic reticulum (ER) stress, accumulation of dysfunctional mitochondria, oxidative stress, activation of AMPK, and a marked decrease in protein synthetic capacity that is accompanied by loss of rough ER. Atg7(Δpan) mice also exhibit spontaneous activation of regenerative mechanisms that initiate acinar-to-ductal metaplasia (ADM), a process that replaces damaged acinar cells with duct-like structures.

Keywords: ATG7; autophagy; pancreatitis; protein synthesis.


Conflict of interest statement

The authors declare no conflict of interest.

Figures

Fig. 1.
Fig. 1.
Atg7∆pan mice exhibit pancreatic degeneration, inflammation, and fibrosis. (A) IB analysis of ATG7 in pancreatic lysates of 12-wk-old mice of indicated genotypes. (B) Gross morphology of pancreata in 12-wk-old Atg7F/F and Atg7pan mice. (C) H&E staining of pancreatic tissue sections from 4- and 12-wk-old mice. (Scale bars, 100 μm.) (D) Histological analysis (IHC) of pancreatic sections from 12 wk old Atg7F/F and Atg7pan mice. Sirius Red, TUNEL, and Ki67 staining, and corresponding quantitation of positive cells per high power (200×) field (HPF). (Scale bars, 100 μm.) (E) IB analysis of caspase 8 in pancreatic lysates from 3-wk-old mice. ERK1/2: loading control. (F) qPCR analysis of α-SMA (Acta2), collagen1A(I) (Col1a1) and collagen 3A(I) (Col3a1) mRNAs in 12-wk-old mice of indicated genotypes. Values in D and F are means ± SEM n = 3–4 mice per condition. *P < 0.05, **P < 0.01, ***P < 0.001.
Fig. S1.
Fig. S1.
Loss of pancreatic ATG7 results in inflammation, acinar cell death, and compensatory proliferation. (A) PCNA and amylase co-IF in pancreatic sections from 12-wk-old mice of the indicated genotype. (Scale bars, 200 μm.) (B) qPCR analysis of cytokine, chemokine, and immune cell marker mRNAs. Values are means ± SEM n = 3–4 mice per condition. *P < 0.05; ***P < 0.001.
Fig. 2.
Fig. 2.
Loss of pancreatic ATG7 results in acinar cell damage. (AC) Analysis of acinar cell markers in 12-wk-old Atg7F/F and Atg7∆pan mice by IB (A), qPCR (B), IHC (C, Top), or IF (C, Bottom). Results in B are means ± SEM n = 3–4 mice per condition. *P < 0.05. [Scale bars in C, 50 μm (IHC) and 100 μm (IF).] (D) Trypsin activity in pancreata of 4- and 12-wk-old Atg7F/F and Atg7∆pan mice. Results are means ± SEM n = 6 (4 w), n = 3 (12 w). *P = 0.06.
Fig. 3.
Fig. 3.
Impaired autophagy and p62 accumulation in Atg7∆pan pancreata. (A) Autophagic flux in Atg7F/F and Atg7Δpan primary acinar cells treated or not with the ER stress-inducer tunicamycin (10 μg/mL, 4 h) in the absence (not treated, NT) or presence of the autophagy inhibitor 3-MA (10 mM), and MG132 (100 nM). Results are means ± SEM of triplicates. n = 3–4 mice per condition. *P < 0.05. (B) IB analysis of LC3B and p62 in pancreatic lysates from 12-wk-old mice. (C) p62 IHC of pancreatic sections from 12-wk-old mice of the indicated genotype. (Scale bars, 100 μm.) (D) qPCR analysis of p62 mRNA. Results are means ± SEM of triplicates. n = 3–4 mice per condition. *P < 0.05.
Fig. S2.
Fig. S2.
Impaired autophagy and p62 accumulation in Atg7pan pancreata. (A) p62 IB in primary acinar cells. Tubulin loading control, *nonspecific band. (B) IHC of pancreatic sections from 12-wk-old mice of the indicated genotype. (Scale bars, 100 μm.) (C) qPCR analysis of autophagy-related mRNAs. Results are means ± SEM of triplicates. n = 3–4 mice per condition.
Fig. 4.
Fig. 4.
Loss of ATG7 results in ER stress. (A) IF analysis of p62-containing protein aggregates in Atg7F/F and AtgΔpan pancreata. (Scale bars, 20 μm.) (B) EM images showing dilated ER (arrow) and accumulation of smooth ER, quantified by stereological analysis in 12-wk-old Atg7F/F and Atg7Δpan mice. [Scale bars, 2 μm (Left) and 250 nm (Right).] Results are means ± SEM n = 7–8 micrographs per condition (one mouse for each condition). ***P < 0.001. (C and D) Expression of ER stress markers in pancreata of 12-wk-old Atg7F/F and Atg7Δpan mice. (C) IB analysis of indicated proteins. Loading control: Actin (Top), ERK1/2 (Bottom). (D) Analysis of the indicated mRNAs by qPCR. Results are means ± SEM n = 4 mice per condition. *P < 0.05.
Fig. S3.
Fig. S3.
ATG7 ablation results in accumulation of aberrant mitochondria, oxidative stress and NRF2 activation. (A) Densitometric analysis of indicated proteins from Fig. 4C, after normalization with loading control. (B) Expression of the indicated pancreatic mRNAs was determined by qPCR. Results are means ± SEM of triplicates. n = 3 mice per condition. *P < 0.05 vs. Atg7F/F. (C) DHE staining of pancreatic sections from 12-wk-old Atg7F/F and Atg7Δpan mice. (Scale bars, 100 μm.) (D) Quantification of mitochondrial DNA (mtDNA) per nuclear DNA (nDNA) in pancreata of 12-wk-old mice. Results are means ± SEM of triplicates. n = 3 mice per condition. **P < 0.01 vs. Atg7F/F. (E) NRF2 IF in pancreatic sections from 12-wk-old Atg7F/F and Atg7Δpan mice. (Scale bars, 100 μm.) (F and G) Activation of p53 and its target genes in pancreata of 12-wk-old mice. Results are means ± SEM of triplicates. n = 3 mice per condition. *P < 0.05 vs. Atg7F/F. (H) Relative amounts of phosphorylated AMPKα from Fig. 5F were determined by densitometry after normalization with ERK1/2. (I) Densitometric analysis of phosphorylated mTORC1 targets from Fig. 5G. An arbitrary value of 1.0 was given to the Atg7F/F specimens. Results in H and I are means ± SEM n = 3 mice per condition. *P < 0.05 vs. Atg7F/F.
Fig. 5.
Fig. 5.
ATG7 ablation results in accumulation of aberrant mitochondria, oxidative stress, and activation of protective and counteractive responses. (A) EM images showing accumulation of abnormally looking mitochondria (arrow) in 12-wk-old mice. [Scale bars, 2 μm (Left), 250 nm (Top Right), and 500 nm (Bottom Right).] Healthy vs. damaged mitochondria were quantified by stereological analysis. Results are means ± SEM n = 7–8 micrographs per condition (one mouse for each condition). ***P < 0.001. (B) Mfn1 and Parkin expression in pancreata of above mice. Protein amounts were determined by densitometry and normalized to actin (Bottom). (C) Protein expression of NRF2 and NQO1 in primary acinar cell (NRF2), and total prancreata samples (NQO1) of 12-wk-old Atg7F/F and Atg7Δpan mice. (D) Expression of the indicated pancreatic mRNAs was determined by qPCR. Results are means ± SEM of triplicates. n = 3 mice per condition. *P < 0.05, **P < 0.01 vs. Atg7F/F. (E) IB analysis of antiapoptotic proteins. (F) IB analysis of total and phosphorylated AMPKα in 12-wk-old pancreata. (G) IB analysis of phosphorylated mTORC1 targets in pancreatic lysates. (H) Protein synthesis in primary acinar cells of Atg7pan and Atg7F/F mice, quantified as the ratio of [3H]-leucine incorporated into TCA insoluble material between control and cycloheximide (30 µg/mL) treated cells. *P < 0.05 vs. Atg7F/F. Results are means ± SEM of triplicates. n = 3 mice per condition.
Fig. 6.
Fig. 6.
Acinar-to-ductal metaplasia and role of oxidative stress in Atg7Δpan pancreatitis. (A) Relative mRNA expression of indicated genes determined by qPCR. Results are means ± SEM of triplicates. n = 3 mice per condition. *P < 0.05 vs. Atg7F/F. (B) Sox9 and Hes1 in total pancreatic lysates of 12-wk-old mice. (C) H&E staining of pancreatic sections from 12-wk-old mice. ADM-like structures indicated by arrows. [Scale bars, 100 μm (Left) and 20 μm (Right).] (D) H&E staining of pancreatic tissue sections from 12-wk-old Atg7F/F and AtgΔpan mice fed with BHA-containing (0.7%) diet (BHA) or normal chow (Ctr) for 4 wk. (Scale bars, 50 μm.) (E and F) mRNA analysis of the indicated genes in total pancreata samples treated as described in D. Results are means ± SEM of triplicates. n = 4 mice per condition. *P < 0.05 vs. Atg7F/FCtr.
Fig. S4.
Fig. S4.
The Atg7Δpan phenotype is only partially rescued by additional p62 ablation. (A) Amylase (Amy2a) (Left), Nqo1 and Gstm1 (Right) mRNA amounts in pancreata of indicated genotypes. Results are means ± SEM n = 3 mice per condition. *P < 0.05 vs. Atg7pan; p62F/F. (B) mRNA analysis of the indicated genes. Results are means ± SEM n = 3 mice per condition. *P < 0.05 vs. Atg7 F/F; p62F/F. **P < 0.01 vs. Atg7pan; p62F/F. (C) IB analysis of total pancreatic lysates from mice of indicated genotypes. Tubulin: loading control. (D) P-PERK and P-eIF2a IB analysis of total pancreatic lysates from mice of indicated genotypes. Tubulin loading control.
Fig. S5.
Fig. S5.
Role of oxidative stress in the Atg7Δpan pancreatitis model. (A) Amy2a mRNA analysis in primary acinar cell of the indicated genotype, treated with BHA (5 μM) or vehicle Ctr for 48 h. (B and D) mRNA analysis of the indicated genes in total pancreata from 12-wk-old Atg7F/F and AtgΔpan mice fed with BHA-containing (0.7%) diet (BHA) or normal chow (Ctr) for 4 wk. Results are means ± SEM of triplicates. n = 4 mice per condition. *P < 0.05 vs. Atg7F/FCtr. (C) IB analysis of the indicted proteins in total pancreatic lysates treated as describe in B.

References

    1. Case RM. Synthesis, intracellular transport and discharge of exportable proteins in the pancreatic acinar cell and other cells. Biol Rev Camb Philos Soc. 1978;53(2):211–354. - PubMed
    1. Logsdon CD, Ji B. The role of protein synthesis and digestive enzymes in acinar cell injury. Nat Rev Gastroenterol Hepatol. 2013;10(6):362–370. - PMC - PubMed
    1. Wang M, Kaufman RJ. The impact of the endoplasmic reticulum protein-folding environment on cancer development. Nat Rev Cancer. 2014;14(9):581–597. - PubMed
    1. Sah RP, et al. Endoplasmic reticulum stress is chronically activated in chronic pancreatitis. J Biol Chem. 2014;289(40):27551–27561. - PMC - PubMed
    1. LaRusch J, Solomon S, Whitcomb DC. 1993. Pancreatitis Overview, eds Pagon RA, et al. (GeneReviews, University of Washington, Seattle)

Publication types

Substances