. 2015 Nov 10;112(45):13874-9.
doi: 10.1073/pnas.1512994112. Epub 2015 Oct 28.

Dynamic membrane protein topological switching upon changes in phospholipid environment

Affiliations

Dynamic membrane protein topological switching upon changes in phospholipid environment

Heidi Vitrac et al. Proc Natl Acad Sci U S A. .

Abstract

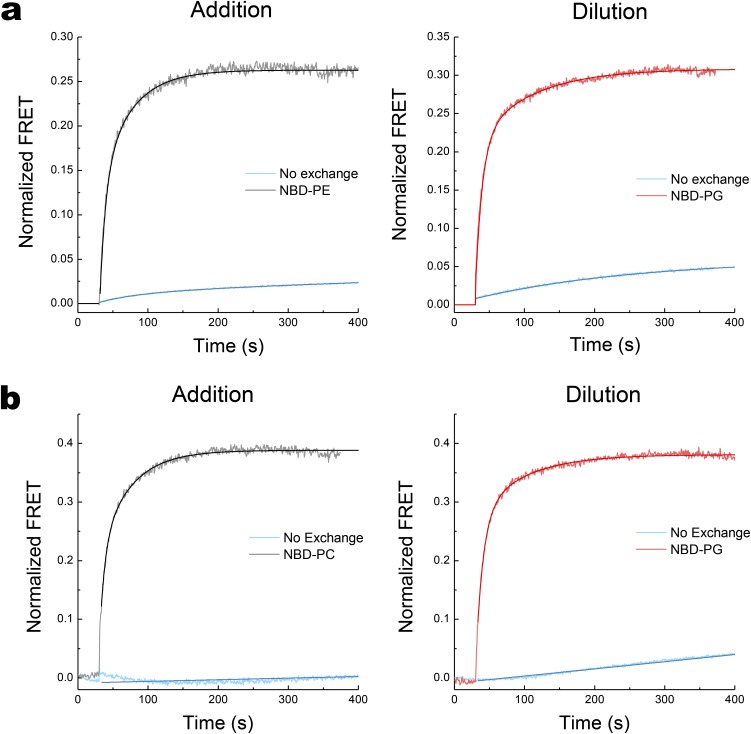
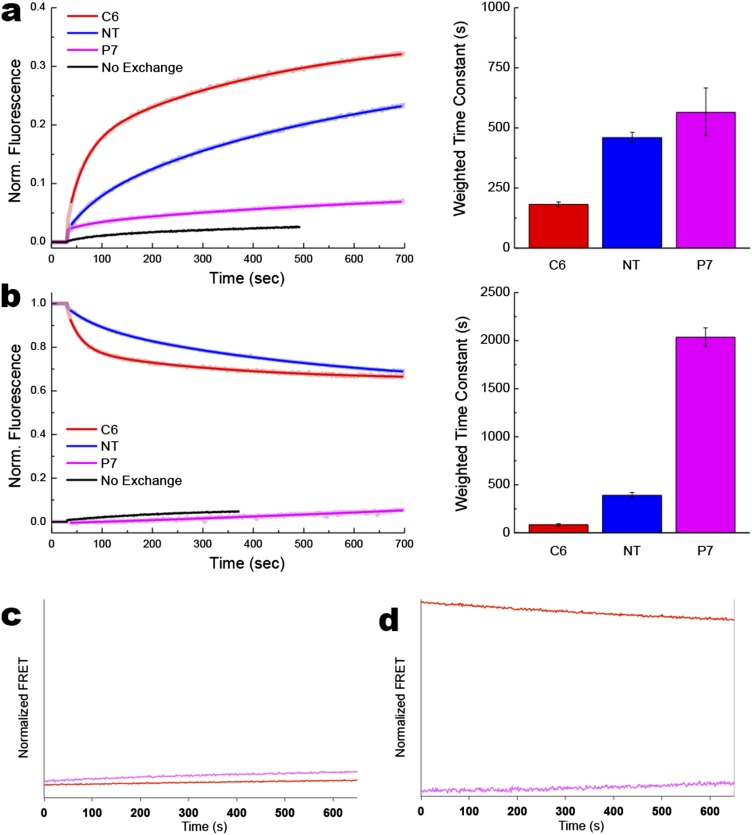
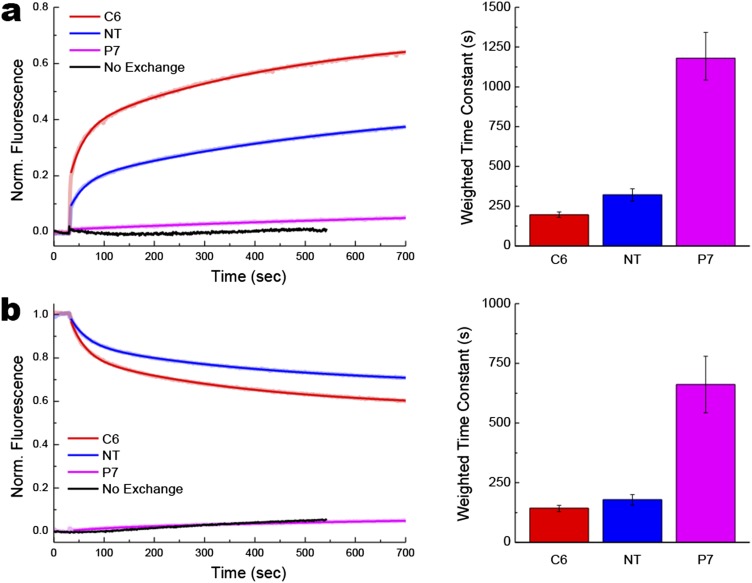
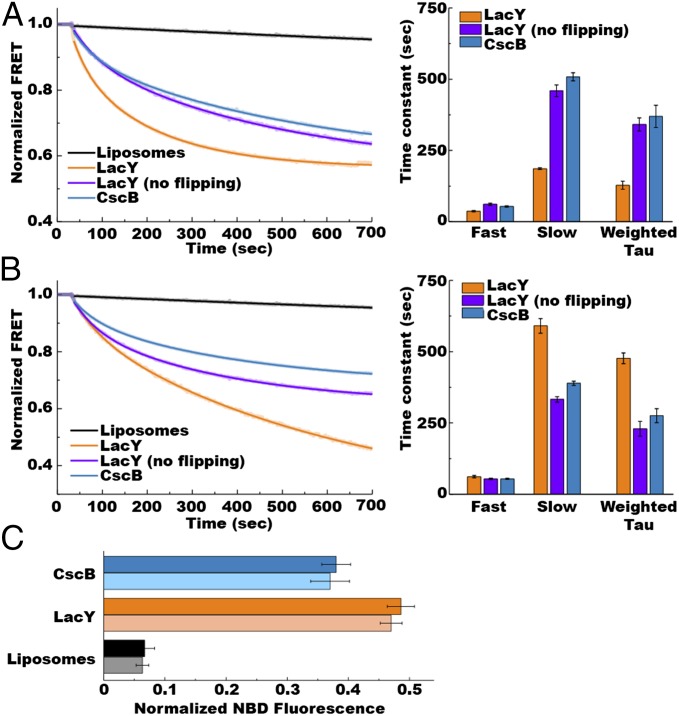
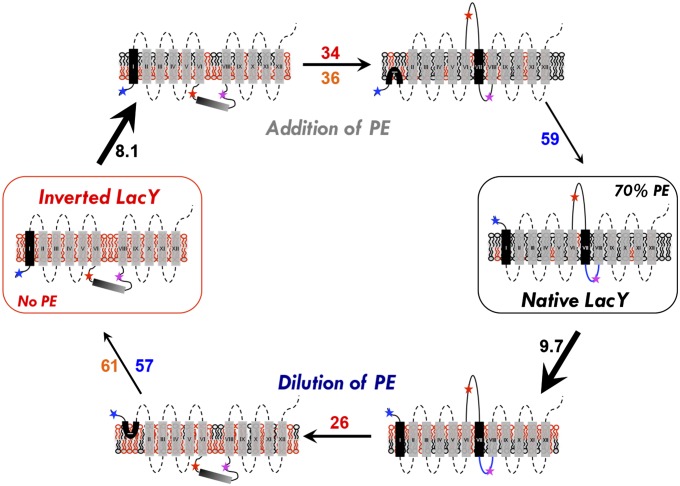
A fundamental objective in membrane biology is to understand and predict how a protein sequence folds and orients in a lipid bilayer. Establishing the principles governing membrane protein folding is central to understanding the molecular basis for membrane proteins that display multiple topologies, the intrinsic dynamic organization of membrane proteins, and membrane protein conformational disorders resulting in disease. We previously established that lactose permease of Escherichia coli displays a mixture of topological conformations and undergoes postassembly bidirectional changes in orientation within the lipid bilayer triggered by a change in membrane phosphatidylethanolamine content, both in vivo and in vitro. However, the physiological implications and mechanism of dynamic structural reorganization of membrane proteins due to changes in lipid environment are limited by the lack of approaches addressing the kinetic parameters of transmembrane protein flipping. In this study, real-time fluorescence spectroscopy was used to determine the rates of protein flipping in the lipid bilayer in both directions and transbilayer flipping of lipids triggered by a change in proteoliposome lipid composition. Our results provide, for the first time to our knowledge, a dynamic picture of these events and demonstrate that membrane protein topological rearrangements in response to lipid modulations occur rapidly following a threshold change in proteoliposome lipid composition. Protein flipping was not accompanied by extensive lipid-dependent unfolding of transmembrane domains. Establishment of lipid bilayer asymmetry was not required but may accelerate the rate of protein flipping. Membrane protein flipping was found to accelerate the rate of transbilayer flipping of lipids.

Keywords: lipid–protein interactions; membrane protein; phospholipids; real-time FRET; topology.


Conflict of interest statement

The authors declare no conflict of interest.

Figures

Fig. 1.
Fig. 1.
Effect of changes in PE content on the orientation of domains C6, P7, or NT of LacY in lipid bilayers subjected to lipid exchange. TMD (I–XII) orientation is summarized for LacY in cell membranes or proteoliposomes containing 70% (Left), intermediate (Center), or 0% (Right) PE; the remaining lipid is PG plus CL. Stars indicate positions of single Cys or Trp replacements in EMDs used to determine topological orientation. The bold P7 EMD indicates proper folding of the P7 epitope only in the presence of PE.
Fig. 2.
Fig. 2.
Detection of topological rearrangements in LacY by Trp-IAEDANS FRET. The bar graph shows the percentage of normalized FRET (black and gray) or percentage of properly oriented LacY as determined by the Cys accessibility method (SCAM; diagonal and white) [data from Vitrac et al. (7)] as a function of PE content in proteoliposomes for Trp replacement in C6 (black) and NT (gray) and single Cys replacements in C6 (diagonal) and NT (white). The graph represents the average of three different experiments, with error bars indicating SD. Normalization of FRET was performed using proteoliposomes containing no PE or 70% PE as a minimal or maximal FRET value, respectively. Data represent the normalized FRET expressed as the ratio (F − F0%)/(F70% − F0%), as described in SI Methods. (Inset) Side view of LacY (Protein Data Bank ID code 2CFQ). TMD helices are rainbow-colored from green (TMD I) to orange (TMD XII). Diagnostic Trp replacements introduced individually in EMDs NT, C6, and P7 are shown with the indicated positions of Cα atoms of Trp (magenta spheres). The IAEDANS label is at Cys331 (blue sphere).
Fig. S1.
Fig. S1.
Use of Trp-IAEDANS FRET as a reporter of LacY topological rearrangement. (A) Trp fluorescence of LacY containing a diagnostic Trp replacement in EMD C6 observed with unlabeled H205W/V331C mutant. AU, arbitrary units. Spectra were recorded with excitation at 295 nm for 1 μM protein in 10 mM Tris⋅HCl (pH 7.5). An increase in Trp fluorescence as a function of PE content is indicated by the upward black arrow. (B) Quenching of Trp fluorescence (indicated by the black arrow) in the C6 EMD of LacY and appearance of Trp-IAEDANS FRET (indicated by the blue arrow) observed with IAEDANS-labeled H205W/V331C mutant. Spectra were recorded with excitation at 295 nm for 1 μM protein in 10 mM Tris⋅HCl (pH 7.5). (C) Fluorescence of LacY containing a diagnostic Trp replacement in EMD P7 observed with IAEDANS-labeled F250W/V331C mutant. Spectra were recorded with excitation at 295 nm for 1 μM protein in 10 mM Tris⋅HCl (pH 7.5). (D) Fluorescence of LacY containing only its six native Trp residues with IAEDANS-labeled V331C mutant. Spectra were recorded with excitation at 295 nm for 1 μM protein in 10 mM Tris⋅HCl (pH 7.5). (E) FRET efficiency as a function of the amount of PE present in LacY proteoliposomes. FRET efficiency (E) was calculated from steady-state fluorescence spectra as E = 1 − (FDA/FD), where FDA and FD are the donor fluorescence intensities at 340 nm in the presence and absence of the acceptor, respectively. Experiments were performed in triplicate, and error bars indicate SD (black, Trp in C6; gray, Trp in NT). (F) Real-time measurements of Trp fluorescence (Upper) and IAEDANS fluorescence (Lower) after excitation at 295 nm. (Upper) Red (C6) and blue (NT) traces indicate Trp fluorescence observed with unlabeled H205W/V331C and L14W/V331C mutants, respectively, upon addition of PE; the black trace indicates Trp fluorescence observed with unlabeled H205W/V331C in the absence of lipid exchange; and magenta and orange traces indicate Trp fluorescence observed with unlabeled V331C containing only endogenous Trp (no Trp replacement in EMDs) upon addition and dilution of PE, respectively. (Lower) Red (C6) and blue (NT) traces indicate FRET observed with IAEDANS-labeled H205W/V331C and L14W/V331C mutants, respectively, upon addition of PE, and the black trace indicates FRET observed with IAEDANS-labeled H205W/V331C in the absence of lipid exchange.
Fig. 3.
Fig. 3.
Rate of lipid exchange, protein flipping, and lipid flipping during addition (A) or dilution (B) of PE in proteoliposomes. Normalized FRET (y axis) represents values calculated in Figs. S2 and S3 and plotted on the same scale. (A) Addition of PE was performed with MLVs made of total lipid extracts from PE-containing E. coli (75% PE/15% PG/5% CL) and proteoliposomes or liposomes made of total lipid extracts from PE-lacking E. coli (50% PG/45% CL). (B) Lipid compositions for MLVs and proteoliposomes or liposomes were reversed to perform dilution of PE. Lipid exchange (black traces): Lipid exchange was triggered by addition of proteoliposomes to MβCD-loaded MLVs 30 s after stabilization of fluorescence, with FRET changes measured at 0.5-s intervals. Protein flipping: Lipid exchange was triggered by addition of MβCD-loaded MLVs to proteoliposomes 30 s after stabilization of fluorescence, with FRET changes measured at 0.5-s intervals. Red (C6) and blue (NT) traces indicate FRET observed with IAEDANS-labeled H205W/V331C and L14W/V331C mutants, respectively. Lipid flipping: NBD-PE quenching by dithionite for protein-free liposomes (gray traces) or proteoliposomes containing LacY (orange traces) under conditions that promote LacY flipping. Lipid exchange was triggered by addition of liposomes or proteoliposomes to MβCD-loaded MLVs 30 s after stabilization of fluorescence, with quenching kinetics measured at 1-s intervals. The experiments were repeated three to five times, and the data represent mean values ± lower and upper confidence limits from exponential fits of the data. The bar graph displays weighted average time constants from Table S1.
Fig. S2.
Fig. S2.
Characterization of the lipid exchange between MLVs and proteoliposomes. Real-time FRET measurements during addition or dilution of PE (A) or PC (B) are displayed. PE or PC was added to proteoliposomes containing total lipid extracts from PE-lacking E. coli (50% PG plus 45% CL) in the presence of MβCD-loaded MLVs containing total lipid extracts from PE-containing (75% PE/15% PG/5% CL) or PC-containing (70% PC/5% PG/26% CL) E. coli. Dilution of PE or PC was for proteoliposomes containing total lipid extracts from PE-containing or PC-containing E. coli in the presence of MβCD-loaded MLVs containing total lipid extracts from PE-lacking E. coli. FRET kinetics were measured every 0.5 s before and after starting the lipid exchange. Lipid exchange was triggered at 30 s after stabilization of the fluorescent signal by addition of proteoliposomes to MβCD-loaded MLVs. FRET was also measured in the absence of MβCD under conditions of no lipid exchange. Normalized FRET was determined using the ratio (F − Fmin)/(Fmax − Fmin) as described in SI Methods. The experiments were repeated four times, and the data represent mean values ± lower and upper confidence limits from exponential fits of the data.
Fig. S3.
Fig. S3.
Protein topological rearrangements triggered by changes in PE content of the proteoliposomes. Real-time FRET measurements of proteoliposomes containing LacY and submitted to lipid exchange to trigger addition (A) or dilution (B) of PE. Changes in phospholipid composition were as described in Fig. S2. Lipid exchange was triggered by addition of MβCD-loaded MLVs to proteoliposomes 30 s after stabilization of fluorescence, with kinetics measured at 0.5-s intervals. Control lipid exchange kinetics [C and D (corresponding to A and B, respectively)] represent lipid exchange triggered between MβCD-loaded MLVs and proteoliposomes of the same lipid composition. Red (C6), blue (NT), and magenta (P7) traces indicate Trp-IAEDANS FRET observed with IAEDANS-labeled H205W/V331C, L14W/V331C, and F250W/V331C mutants, respectively. Black traces indicate measurements performed in the absence of lipid exchange. Data represent the normalized FRET expressed as the ratio (F(t) − F0)/(Fmax − F0), as described in SI Methods. The experiments were repeated three to five times, and the data represent mean values ± lower and upper confidence limits from exponential fits of the data. Bar graphs summarized time constants shown in Table S1.
Fig. S4.
Fig. S4.
Protein topological rearrangements triggered by changes in PC content in the proteoliposomes. Real-time FRET measurements of proteoliposomes containing LacY and submitted to lipid exchange to trigger addition (A) or dilution (B) of PC. Changes in phospholipid composition were as described in Fig. S2. Lipid exchange was triggered by addition of MβCD-loaded MLVs to proteoliposomes 30 s after stabilization of fluorescence, with kinetics measured at 0.5-s intervals. Red (C6), blue (NT), and magenta (P7) traces indicate Trp-IAEDANS FRET observed with IAEDANS-labeled H205W/V331C, L14W/V331C, and F250W/V331C mutants, respectively. Black traces indicate measurements performed in the absence of lipid exchange as described in Fig. S3. Data represent the normalized FRET expressed as the ratio (F(t) − F0)/(Fmax − F0), as described in SI Methods. The experiments were repeated three to five times, and the data represent mean values ± lower and upper confidence limits from exponential fits of the data. Bar graphs summarized time constants shown in Table S1.
Fig. 4.
Fig. 4.
Lipid flipping across the lipid bilayers upon changes in phospholipid composition. Real-time NBD-PE quenching by dithionite measurements of protein-free liposomes (black traces) or proteoliposomes containing either LacY (orange and purple traces) or CscB (blue traces) and submitted to lipid exchange to trigger addition (A) or dilution (B) of PE is displayed. (A) Addition of PE was performed with MLVs made of total lipid extracts from PE-containing E. coli (75% PE/15% PG/5% CL) and proteoliposomes or from liposomes made of total lipid extracts from PE-lacking E. coli (50% PG/45% CL). (B) Lipid compositions for MLVs and proteoliposomes or liposomes were reversed to perform dilution of PE. Lipid exchange was triggered by addition of liposomes or proteoliposomes to MβCD-loaded MLVs 30 s after stabilization of fluorescence, with quenching kinetics measured at 1-s intervals. (C) Histogram shows percentage of normalized NBD fluorescence measured after 30 min of lipid exchange in liposomes and proteoliposomes containing LacY or CscB when performing resupply (dark-colored bars) or dilution (light-colored bars) of PE. Data represent the mean ± SD of six independent experiments. Data represent the normalized NBD-PE fluorescence expressed as the ratio (F(t) − F0)/(Fmax − F0), as described in SI Methods. The experiments were repeated three to five times, and the data represent mean values ± lower and upper confidence limits from exponential fits of the data. The bar graph displays time constants from Table S1.
Fig. 5.
Fig. 5.
Schematic model of the events occurring during lipid-induced topological switching of LacY in proteoliposomes. LacY topology is shown when assembled in proteoliposomes lacking PE (inverted LacY, Left) and in proteoliposomes containing WT amounts of PE (Native LacY, Right), before and during lipid exchange. Stars indicate positions of diagnostic Trp replacements used to determine topological orientation of EMDs (blue, red, and magenta correspond to NT, C6, and P7, respectively). The blue P7 loop indicates proper folding of the P7 epitope. Membrane phospholipids are depicted as follows: black, PE; red, anionic lipids (PG and CL). The time constant value (s−1) of each event is indicated as follows: black, lipid exchange; red, C6 flipping; blue, NT flipping; orange, lipid flipping. In both addition and dilution of PE (or PC), lipid exchange occurs first and is followed by protein topological rearrangement and transbilayer movement of lipid. During lipid exchange, lipids from the outer leaflet of proteoliposomes are exchanged and become enriched with PE (addition of PE) or PG/CL (dilution of PE), leading to transient generation of lipid asymmetry. Protein flipping occurs subsequent to lipid exchange, with C6 EMD flipping being more sensitive to PE (or PC) content than the NT EMD. P7 EMD folding/unfolding is PE-dependent and linked to the topological switch. The rate of C6 EMD flipping is faster during PE dilution, which may be due to specific interaction of LacY with PE. Asymmetrical distribution of lipids across the lipid bilayer may accelerate the rate of protein flipping.

References

    1. Bogdanov M, Dowhan W, Vitrac H. Lipids and topological rules governing membrane protein assembly. Biochim Biophys Acta. 2014;1843(8):1475–1488. - PMC - PubMed
    1. Kaback HR. A chemiosmotic mechanism of symport. Proc Natl Acad Sci USA. 2015;112(5):1259–1264. - PMC - PubMed
    1. Dowhan W. A retrospective: Use of Escherichia coli as a vehicle to study phospholipid synthesis and function. Biochim Biophys Acta. 2013;1831(3):471–494. - PMC - PubMed
    1. Bogdanov M, Xie J, Heacock P, Dowhan W. To flip or not to flip: Lipid-protein charge interactions are a determinant of final membrane protein topology. J Cell Biol. 2008;182(5):925–935. - PMC - PubMed
    1. Bogdanov M, Dowhan W. Lipid-dependent generation of dual topology for a membrane protein. J Biol Chem. 2012;287(45):37939–37948. - PMC - PubMed

Publication types

MeSH terms

LinkOut - more resources