. 2015 Oct 23;12(10):13295-320.
doi: 10.3390/ijerph121013295.

Climate Change Effects on Heat- and Cold-Related Mortality in the Netherlands: A Scenario-Based Integrated Environmental Health Impact Assessment

Affiliations

Climate Change Effects on Heat- and Cold-Related Mortality in the Netherlands: A Scenario-Based Integrated Environmental Health Impact Assessment

Maud M T E Huynen et al. Int J Environ Res Public Health. .

Abstract

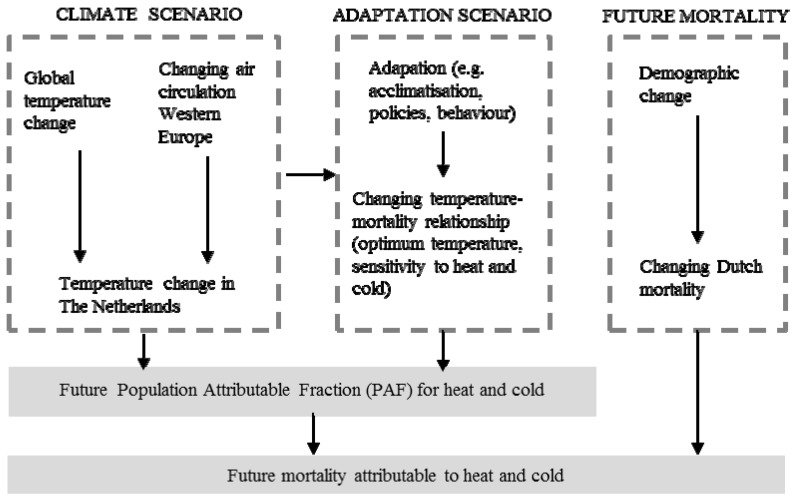
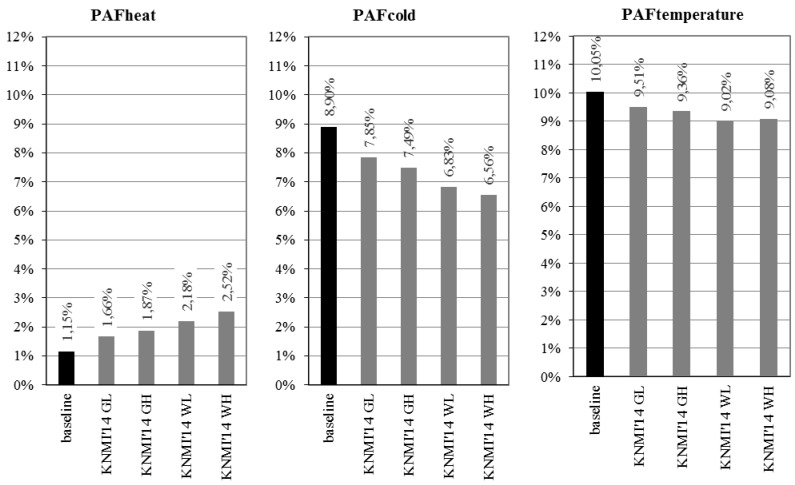
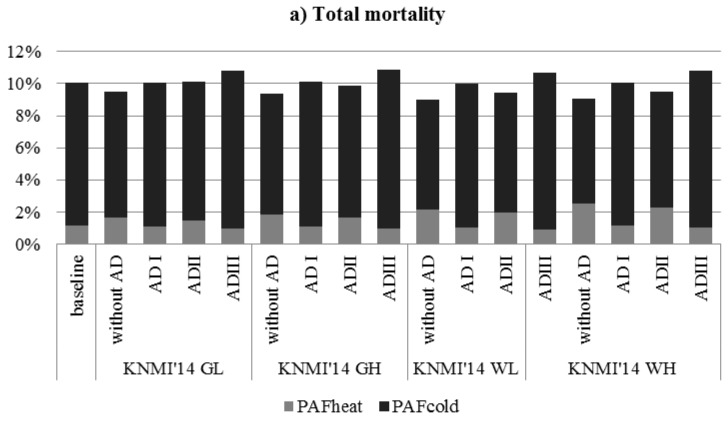
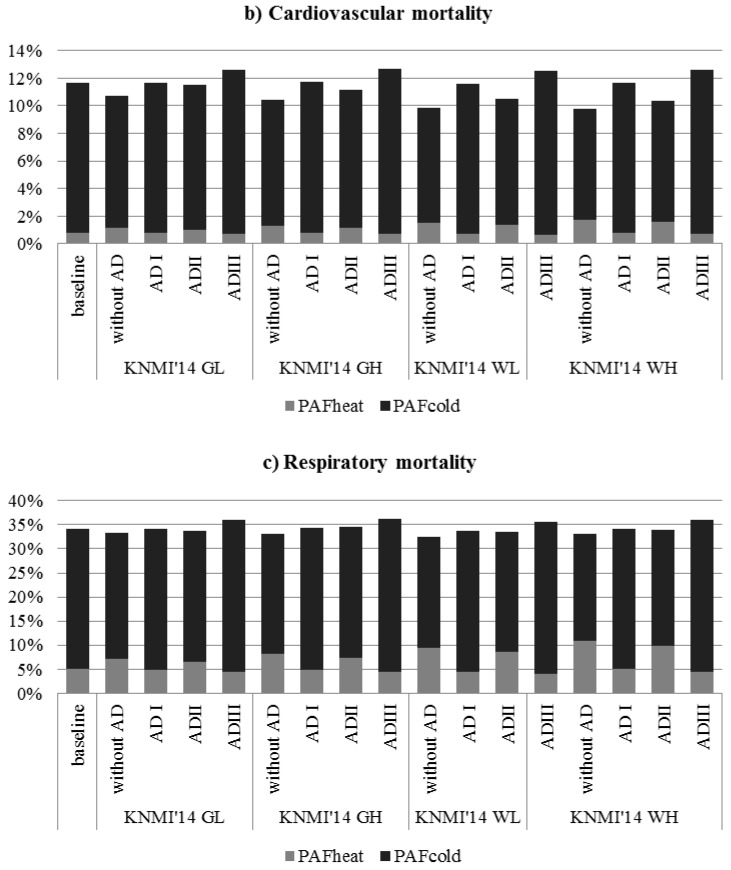
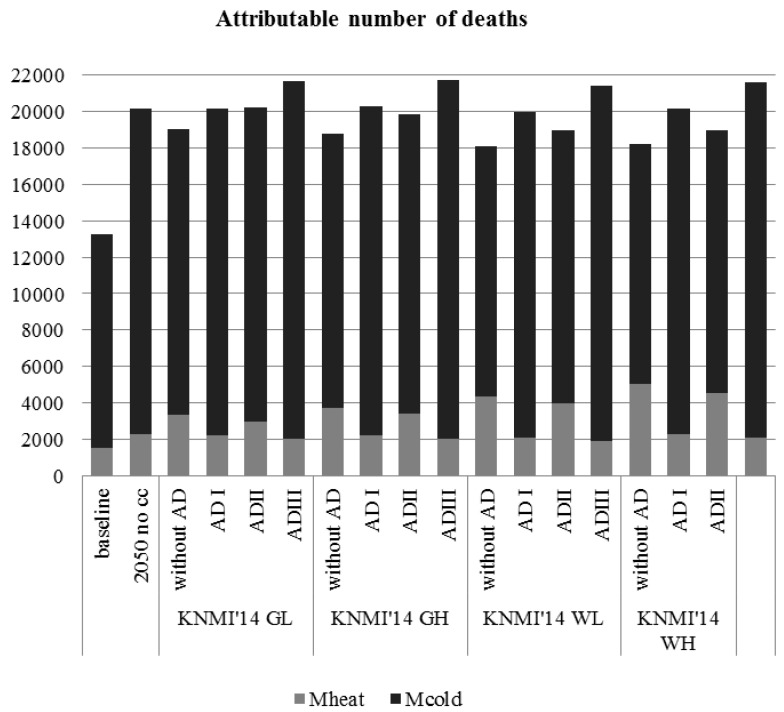
Although people will most likely adjust to warmer temperatures, it is still difficult to assess what this adaptation will look like. This scenario-based integrated health impacts assessment explores baseline (1981-2010) and future (2050) population attributable fractions (PAF) of mortality due to heat (PAFheat) and cold (PAFcold), by combining observed temperature-mortality relationships with the Dutch KNMI'14 climate scenarios and three adaptation scenarios. The 2050 model results without adaptation reveal a decrease in PAFcold (8.90% at baseline; 6.56%-7.85% in 2050) that outweighs the increase in PAFheat (1.15% at baseline; 1.66%-2.52% in 2050). When the 2050 model runs applying the different adaptation scenarios are considered as well, however, the PAFheat ranges between 0.94% and 2.52% and the PAFcold between 6.56% and 9.85%. Hence, PAFheat and PAFcold can decrease as well as increase in view of climate change (depending on the adaptation scenario). The associated annual mortality burdens in 2050-accounting for both the increasing temperatures and mortality trend-show that heat-related deaths will range between 1879 and 5061 (1511 at baseline) and cold-related deaths between 13,149 and 19,753 (11,727 at baseline). Our results clearly illustrate that model outcomes are not only highly dependent on climate scenarios, but also on adaptation assumptions. Hence, a better understanding of (the impact of various) plausible adaptation scenarios is required to advance future integrated health impact assessments.

Keywords: adaptation; climate change; cold; health; heat; mortality; scenarios; temperature.


Figures

Figure 1
Figure 1
The scenario-based integrated environmental health impact approach underlying this study.
Figure 2
Figure 2
Total mortality—Population attributable fractions (PAF) of mortality due to exposure to heat and cold, at baseline (1981–2000) and in 2050 (KNMI’14 scenarios), the Netherlands: model runs without adaptation.
Figure 3
Figure 3
Population attributable fractions (PAF) of mortality (total, cardiovascular, respiratory) due to exposure to heat and cold, at baseline (1981–2000) and in 2050 (KNMI’14 scenarios), the Netherlands: model runs with and without adaptation. Note: without AD = without adaptation; AD I = adaptation scenario I (shift in optimum temperature); AD II = adaptation scenario II (changing sensitivity to heat and cold); AD III = adaptation scenario III (adaptation scenarios I and II combined).
Figure 3
Figure 3
Population attributable fractions (PAF) of mortality (total, cardiovascular, respiratory) due to exposure to heat and cold, at baseline (1981–2000) and in 2050 (KNMI’14 scenarios), the Netherlands: model runs with and without adaptation. Note: without AD = without adaptation; AD I = adaptation scenario I (shift in optimum temperature); AD II = adaptation scenario II (changing sensitivity to heat and cold); AD III = adaptation scenario III (adaptation scenarios I and II combined).
Figure 4
Figure 4
Baseline and future number of deaths attributable to heat (Mheat) and cold (Mcold), at baseline (1981–2000) and in 2050 (KNMI’14 scenarios), the Netherlands: model runs with and without adaptation. Note: 2050 no cc (no climate change) = 2050 model runs applying baseline attributable fractions to future number of annual deaths; without AD = without adaptation; AD I = adaptation scenario I (shift in optimum temperature); AD II = adaptation scenario II (changing sensitivity to heat and cold); AD III = adaptation scenario III (shift in optimum temperature as well as changing sensitivity to heat and cold).

References

    1. IPCC . Climate Change 2013: The Physical Science Basis: Summary for Policymakers. IPCC; Geneva, Switzerland: 2013. Intergovermental Panel on Climate Change, Working Group I Contribution to the IPCC Fifth Assessment Report.
    1. Costello A., Abbas M., Allen A., Ball S., Bell S., Bellamy R.E.A. Managing the health effects of climate change. Lancet. 2009;373:1693–1733. doi: 10.1016/S0140-6736(09)60935-1. - DOI - PubMed
    1. McMichael A.J. Insights from past millenia into climatic impacts on human health survival. Proc. Natl. Acad. Sci. USA. 2012;109:4730–4737. doi: 10.1073/pnas.1120177109. - DOI - PMC - PubMed
    1. Anstey M. Climate change and health—What’s the problem? Glob. Health. 2013;9 doi: 10.1186/1744-8603-9-4. - DOI - PMC - PubMed
    1. Patz J.A., Frumkin H., Holloway T., Vimont D.J., Haines A. Climate change: Challenges and opportunities for global health. JAMA. 2014;312:1565–1580. doi: 10.1001/jama.2014.13186. - DOI - PMC - PubMed

LinkOut - more resources