. 2015 Oct 29;11(10):e1004513.
doi: 10.1371/journal.pcbi.1004513. eCollection 2015 Oct.

Combining Search, Social Media, and Traditional Data Sources to Improve Influenza Surveillance

Affiliations

Combining Search, Social Media, and Traditional Data Sources to Improve Influenza Surveillance

Mauricio Santillana et al. PLoS Comput Biol. .

Abstract

We present a machine learning-based methodology capable of providing real-time ("nowcast") and forecast estimates of influenza activity in the US by leveraging data from multiple data sources including: Google searches, Twitter microblogs, nearly real-time hospital visit records, and data from a participatory surveillance system. Our main contribution consists of combining multiple influenza-like illnesses (ILI) activity estimates, generated independently with each data source, into a single prediction of ILI utilizing machine learning ensemble approaches. Our methodology exploits the information in each data source and produces accurate weekly ILI predictions for up to four weeks ahead of the release of CDC's ILI reports. We evaluate the predictive ability of our ensemble approach during the 2013-2014 (retrospective) and 2014-2015 (live) flu seasons for each of the four weekly time horizons. Our ensemble approach demonstrates several advantages: (1) our ensemble method's predictions outperform every prediction using each data source independently, (2) our methodology can produce predictions one week ahead of GFT's real-time estimates with comparable accuracy, and (3) our two and three week forecast estimates have comparable accuracy to real-time predictions using an autoregressive model. Moreover, our results show that considerable insight is gained from incorporating disparate data streams, in the form of social media and crowd sourced data, into influenza predictions in all time horizons.


Conflict of interest statement

The authors have declared that no competing interests exist.

Figures
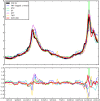
Fig 1
Fig 1. The CDC’s %ILI (Influenza like illnesses), the performance of the 5 available predictors, the baseline predictions, and the performance of the best ensemble method for last week’s predictions are displayed as a function of time (top).
The errors associated with each weak predictor and the ensemble approach are shown (bottom).
Fig 2
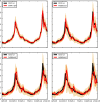
Fig 2. The best performing ensemble approach is shown in red side by side to the CDC’s % ILI for all time horizons: last week (top left), current week (top right), next week (bottom left), and two weeks from current (bottom right).
The dark error bars correspond to the relative root mean squared error (RRMSE) and the light error bars correspond to the relative maximum absolute error.
Fig 3
Fig 3. The CDC’s %ILI (Influenza like illnesses) and the performance of multiple machine learning ensemble approaches that combine the 5 weak predictors to produce a single estimate are displayed for comparison for the four time horizons: last week (top left), current week (top right), next week (bottom left), and two weeks from current (bottom right).
The red curve displays the performance of the best method for a given time horizon. As expected, the accuracy and robustness of the predictions decrease as the time horizon increases.
Fig 4
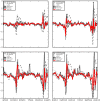
Fig 4. Errors associated with each ensemble approach are displayed for all time horizons: last week (top left), current week (top right), next week (bottom left), and two weeks from current (bottom right).

References

    1. Lipsitch M, Finelli L, Heffernan RT, Leung GM, & Redd S. Improving the evidence base for decision making during a pandemic: the example of 2009 influenza A/H1N1. Biosecurity and bioterrorism: biodefense strategy, practice, and science. 2011; 9(2), 89–115. - PMC - PubMed
    1. WHO (2015) Influenza (Seasonal), Fact Sheet Number 211. Available at http://www.who.int/mediacentre/factsheets/fs211/en/index.html.
    1. Cobb L, Krishnamurthy A, Mandel J, and Beezley JD. Bayesian tracking of emerging epidemics using ensemble optimal statistical interpolation. Spatial and spatio-temporal epidemiology. 2014; 10: 39–48. - PMC - PubMed
    1. Yang W, Karspeck A, and Shaman J. "Comparison of filtering methods for the modeling and retrospective forecasting of influenza epidemics." PLoS computational biology. 2014; 10, no. 4: e1003583 10.1371/journal.pcbi.1003583 - DOI - PMC - PubMed
    1. Yang W, Lipsitch M, and Sham. Inference of seasonal and pandemic influenza transmission dynamics using ‘big’ surveillance data. Proceedings of the National Academy of Sciences. 2015;112(9): 2723–2728. - PMC - PubMed

Publication types