. 2015 Oct 29;10(10):e0141196.
doi: 10.1371/journal.pone.0141196. eCollection 2015.

Distinct Macrophage Fates after in vitro Infection with Different Species of Leishmania: Induction of Apoptosis by Leishmania (Leishmania) amazonensis, but Not by Leishmania (Viannia) guyanensis

Affiliations

Distinct Macrophage Fates after in vitro Infection with Different Species of Leishmania: Induction of Apoptosis by Leishmania (Leishmania) amazonensis, but Not by Leishmania (Viannia) guyanensis

Jarina Pena DaMata et al. PLoS One. .

Abstract

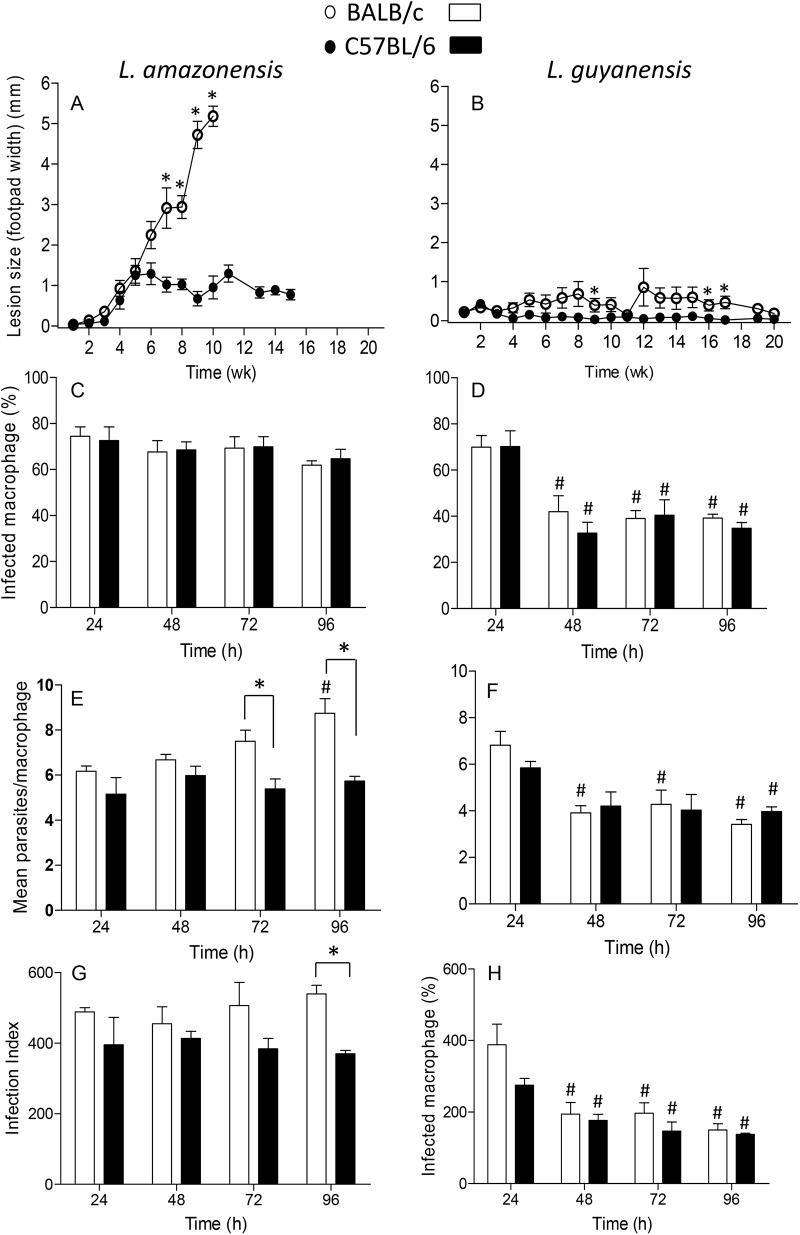
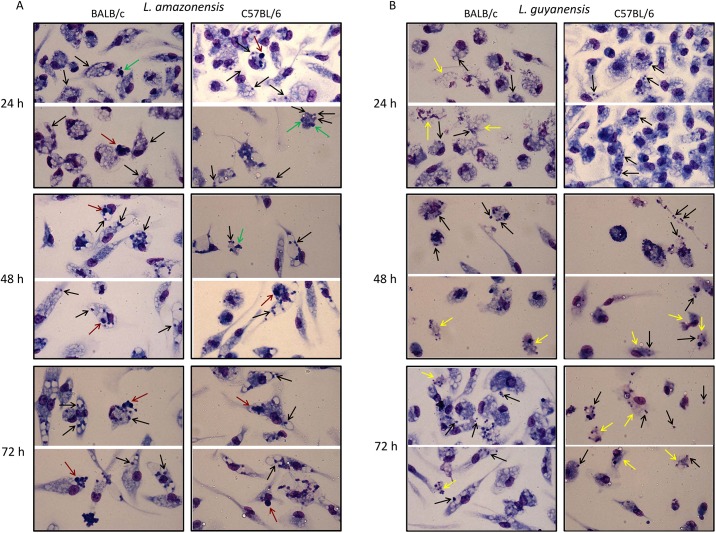
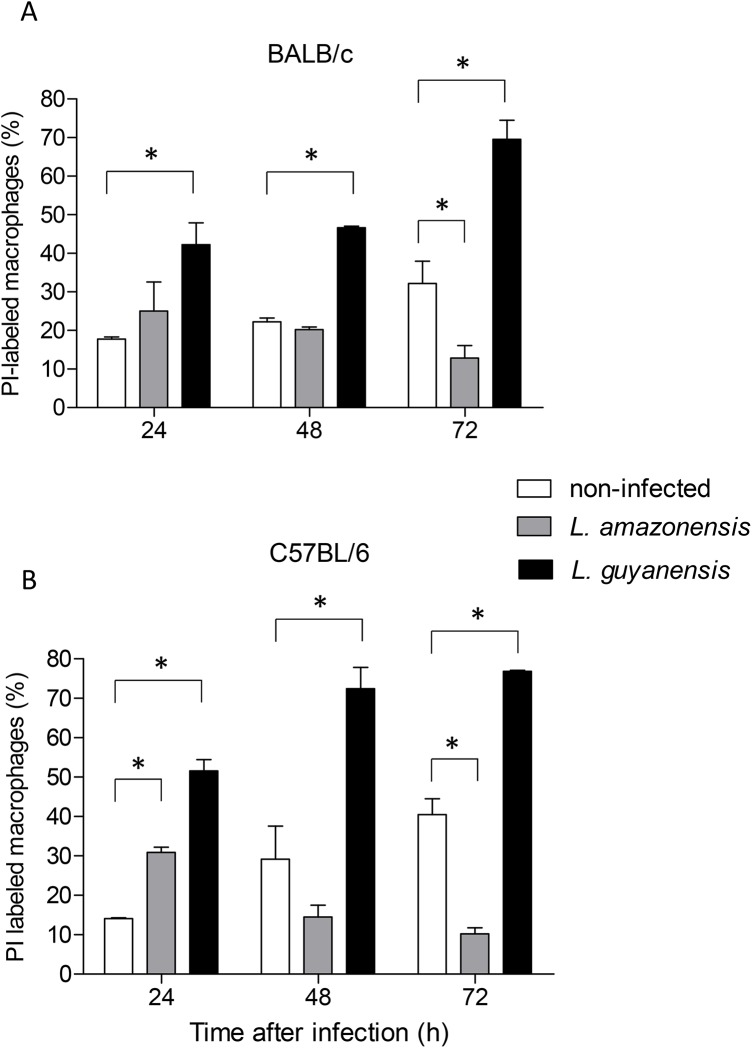
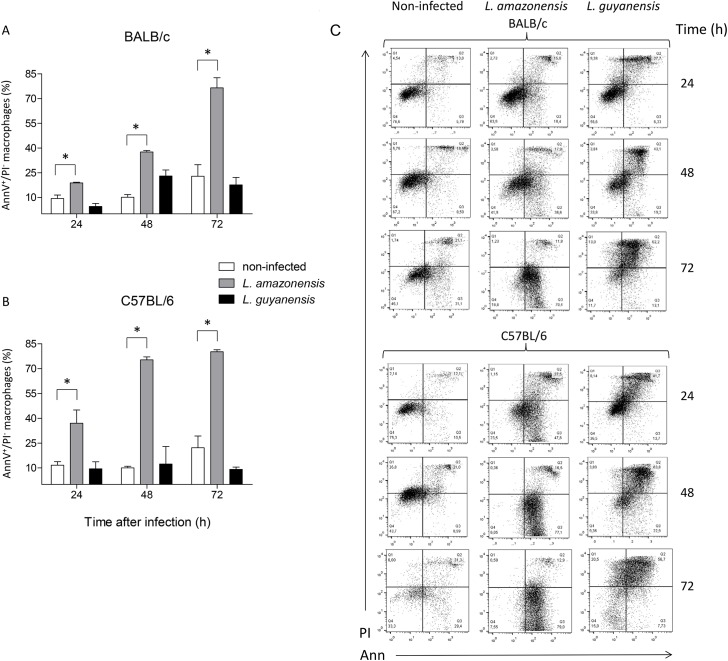
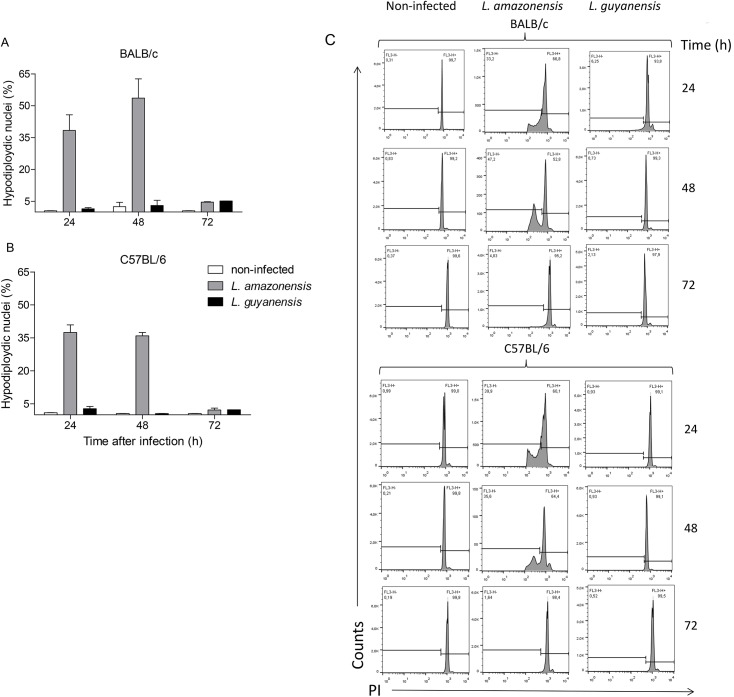
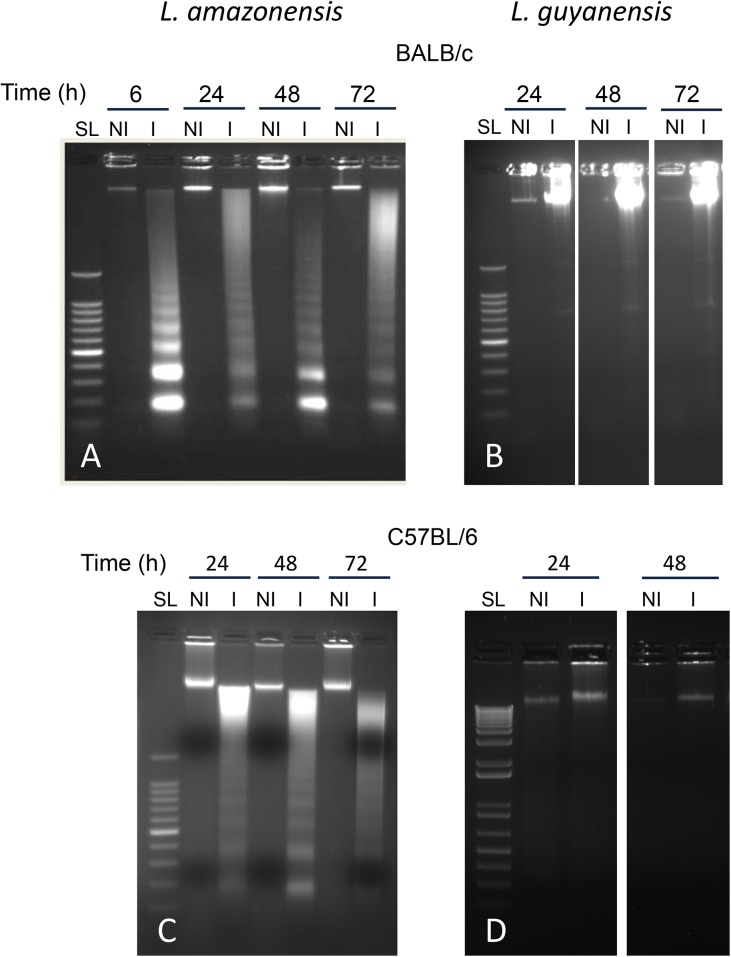
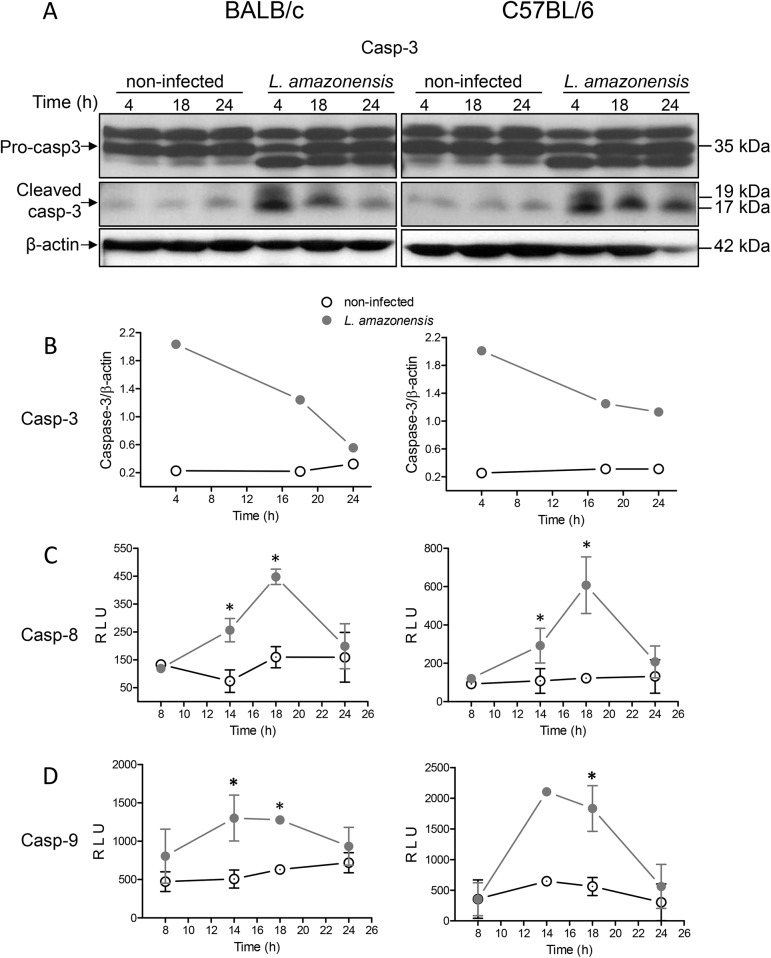
Leishmania is an intracellular parasite in vertebrate hosts, including man. During infection, amastigotes replicate inside macrophages and are transmitted to healthy cells, leading to amplification of the infection. Although transfer of amastigotes from infected to healthy cells is a crucial step that may shape the outcome of the infection, it is not fully understood. Here we compare L. amazonensis and L. guyanensis infection in C57BL/6 and BALB/c mice and investigate the fate of macrophages when infected with these species of Leishmania in vitro. As previously shown, infection of mice results in distinct outcomes: L. amazonensis causes a chronic infection in both strains of mice (although milder in C57BL/6), whereas L. guyanensis does not cause them disease. In vitro, infection is persistent in L. amazonensis-infected macrophages whereas L. guyanensis growth is controlled by host cells from both strains of mice. We demonstrate that, in vitro, L. amazonensis induces apoptosis of both C57BL/6 and BALB/c macrophages, characterized by PS exposure, DNA cleavage into nucleosomal size fragments, and consequent hypodiploidy. None of these signs were seen in macrophages infected with L. guyanensis, which seem to die through necrosis, as indicated by increased PI-, but not Annexin V-, positive cells. L. amazonensis-induced macrophage apoptosis was associated to activation of caspases-3, -8 and -9 in both strains of mice. Considering these two species of Leishmania and strains of mice, macrophage apoptosis, induced at the initial moments of infection, correlates with chronic infection, regardless of its severity. We present evidence suggestive that macrophages phagocytize L. amazonensis-infected cells, which has not been verified so far. The ingestion of apoptotic infected macrophages by healthy macrophages could be a way of amastigote spreading, leading to the establishment of infection.


Conflict of interest statement

Competing Interests: The authors have declared that no competing interests exist.

Figures

Fig 1
Fig 1. Lesion progression in mice infected with L. amazonensis or L. guyanensis and in vitro infection of macrophages.
Groups of 5 BALB/c (open circles) or C57BL/6 (filled circles) mice were infected in one of the hind footpads with 1x10⁶ stationary phase promastigotes of L. amazonensis (A) or L. guyanensis (B). Lesion progression was assessed weekly for up to 20 weeks by measuring the hind footpads. Lesion size was expressed as the difference between infected and non-infected footpad. Each point represents mean ± SE obtained from 5 mice. Macrophages were infected with L. amazonensis (C, E, G) or L. guyanensis (D, F, H) at a 10:1 parasite:macrophage ratio and incubated for up to 4 days. Infected cells were counted and results are expressed as percentage of infected macrophages (C, D), number of parasite/cell (E, F) and infection index (G, H). Infection index was estimated as the mean percentage of infected cells x the mean number of parasites per infected cells. Bars represent mean ± SE of two to six (depending on the time point) independent experiments. Statistically significant differences between the two groups at a P < 0.05 are represented by (*). Statistically significant differences between values of the same group as compared to values at 24h at a P < 0.05 are represented by (#).
Fig 2
Fig 2. In vitro macrophage infection with L. amazonensis or L. guyanensis.
Peritoneal macrophages of BALB/c (left panel) or C57BL/6 mice (right panel) were infected with L. amazonensis or L. guyanensis. After the indicated time points cells were stained with May-Grünwald, followed by Giemsa, method. Images were obtained using QCapture Pro 7 Imaging Software (QImaging) obtained from http://www.qimaging.com/support/softwarereleases/030107_qcappro.php. Black arrows—amastigotes; green arrows—structures reminiscent of apoptotic bodies or condensed nuclei; yellow arrows—structures reminiscent of disintegrated cells; red arrows—structures reminiscent of apoptotic cells that seem to have been phagocytized by (or are attached in) other macrophages.
Fig 3
Fig 3. Loss of macrophage membrane integrity after in vitro infection with L. amazonensis or L. guyanensis.
Peritoneal macrophages of BALB/c (A) or C57BL/6 (B) mice infected or not with L. amazonensis or L. guyanensis were incubated with PI and analyzed by flow cytometry at the time points indicated. Values represent percentage of PI positive cells in culture. Bars represent mean ± SE of two or three (depending on the time point) independent experiments. Statistically significant differences between the two groups indicated, at a P < 0.05, are represented by (*). One typical experiment is shown in dot plots after macrophage gating and analysis by FlowJo (Fig 3C). Gating strategy is shown in S1A Fig.
Fig 4
Fig 4. Exposure of PS by macrophages after in vitro infection with L. amazonensis or L. guyanensis.
Peritoneal macrophages of BALB/c (A) or C57BL/6 (B) mice infected or not with L. amazonensis or L. guyanensis were labeled with AnnV-FITC and counterstained with PI. Analysis was carried out by flow cytometry and only initial moments of apoptosis (AnnV+/PI-) were considered at the indicated time points. Bars represent mean ± SE of two or three (depending on the time point) independent experiments. Statistically significant differences between the two groups indicated, at a P < 0.05, are represented by (*). A typical experiment is shown in dot plots after macrophage gating and analysis by FlowJo (C). Gating strategy is shown in S1A Fig.
Fig 5
Fig 5. Loss of nuclear DNA by macrophages after in vitro infection with L. amazonensis or L. guyanensis.
Peritoneal macrophages of BALB/c (A) or C57BL/6 (B) mice infected or not with L. amazonensis or L. guyanensis. After the indicated time points cells were lysed with hypotonic lysis buffer containing PI and nuclei were analyzed by flow cytometry. Bars represent mean ± SD of three independent experiments. A typical experiment is shown in histograms after macrophage nuclei gating and analysis by FlowJo. Gating strategy of cell nuclei is shown in S1B and S1C Fig.
Fig 6
Fig 6. Macrophage DNA fragmentation pattern after in vitro infection with L. amazonensis or L. guyanensis as shown by agarose gel electrophoresis.
Peritoneal macrophages of BALB/c (A and B) or C57BL/6 mice (C and D) were infected or not with L. amazonensis (A and C) or L. guyanensis (B and D). DNA was extracted after the indicated time points and submitted to electrophoresis on agarose gel at 1.8%. SL—Step Ladder of 100 bp; NI—non-infected; I—infected.
Fig 7
Fig 7. Caspase-3, -8 and -9 activation in macrophages after in vitro infection with L. amazonensis.
Peritoneal macrophages of BALB/c (left panel) or C57BL/6 mice (right panel) were infected or not (NI) with L. amazonensis. After the indicated time points cell lysates were analysed for caspase activation. Caspase-3 activation was analyzed by Western blot (A) and quantified by densitometry using β-actin and the band above pro-caspase-3 as a load control (B). Caspase-8 and caspase-9 activation was analyzed by CaspaseGlo8 (C) or CaspaseGlo9 (D), both detected by luminescence. For caspases 8 and 9, values represent relative light units (RLU) ± SE from two, three or four (depending on the time point) independent experiments, except for time 14h for caspase-9 in C57BL/6 macrophages a value obtained from one experiment. Statistically significant differences between the two groups indicated, at a P < 0.05, are represented by (*).

References

    1. World Health Organization. Leishmaniasis: the disease and its epidemiology. 2014. Available: http://www.who.int/leishmaniasis/disease_epidemiology/en. Accessed January 2015.
    1. Kedzierski L, Evans KJ. Immune response during cutaneous and visceral leishmaniasis. 2014. Parasitology 30: 1–19. - PubMed
    1. World Health Organization. Global Alert and Response. 2014. Available: http://www.who.int/csr/resources/publications/CSR_ISR_2000_1leish/en/. Accessed January 2015.
    1. Gontijo B, de Carvalho ML. Leishmaniose Tegumentar Americana. Rev Soc Bras Med Trop 2003; 36:71–80. - PubMed
    1. Abreu-Silva AL, Calabrese KS, Cupolilo SMN, Cardoso FO, Souza CSF, Gonçalves da Costa SC. Histopathological studies of visceralized Leishmania (Leishmania) amazonensis in mice experimentally infected. Vet Parasitol 2004; 121: 179–187. - PubMed

Publication types