

Review and evaluation of penalised regression methods for risk prediction in low-dimensional data with few events
- PMID: 26514699
- PMCID: PMC4982098
- DOI: 10.1002/sim.6782
Review and evaluation of penalised regression methods for risk prediction in low-dimensional data with few events
Abstract
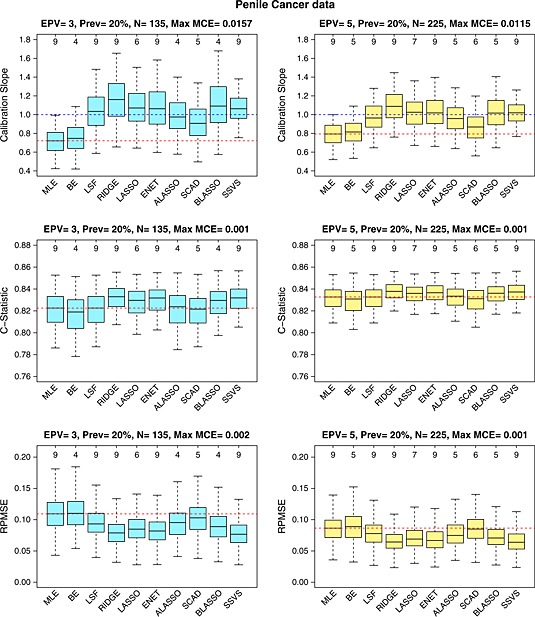
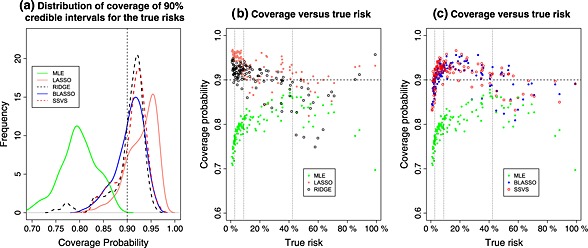
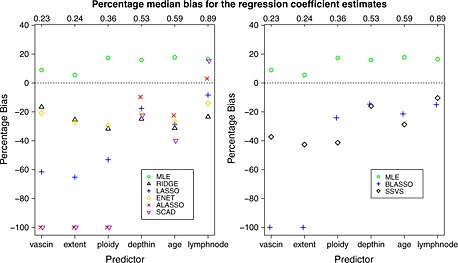
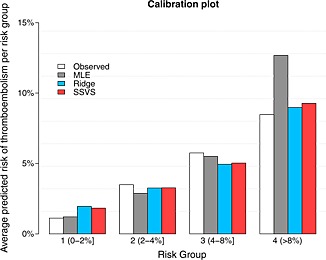
Risk prediction models are used to predict a clinical outcome for patients using a set of predictors. We focus on predicting low-dimensional binary outcomes typically arising in epidemiology, health services and public health research where logistic regression is commonly used. When the number of events is small compared with the number of regression coefficients, model overfitting can be a serious problem. An overfitted model tends to demonstrate poor predictive accuracy when applied to new data. We review frequentist and Bayesian shrinkage methods that may alleviate overfitting by shrinking the regression coefficients towards zero (some methods can also provide more parsimonious models by omitting some predictors). We evaluated their predictive performance in comparison with maximum likelihood estimation using real and simulated data. The simulation study showed that maximum likelihood estimation tends to produce overfitted models with poor predictive performance in scenarios with few events, and penalised methods can offer improvement. Ridge regression performed well, except in scenarios with many noise predictors. Lasso performed better than ridge in scenarios with many noise predictors and worse in the presence of correlated predictors. Elastic net, a hybrid of the two, performed well in all scenarios. Adaptive lasso and smoothly clipped absolute deviation performed best in scenarios with many noise predictors; in other scenarios, their performance was inferior to that of ridge and lasso. Bayesian approaches performed well when the hyperparameters for the priors were chosen carefully. Their use may aid variable selection, and they can be easily extended to clustered-data settings and to incorporate external information.
Keywords: Bayesian regularisation; overfitting; rare events; shrinkage.
© 2015 The Authors. Statistics in Medicine Published by JohnWiley & Sons Ltd.
Figures
References
-
- Moons KGM, Royston P, Vergouwe Y, Grobbee DE, Altman G. Prognosis and prognostic research: what, why, and how? British Medical Journal 2009; 338. - PubMed
-
- Moons KGM, Altman DG, Vergouwe Y, Royston P. Prognosis and prognostic research: application and impact of prognostic models in clinical practice. British Medical Journal 2009; 338. - PubMed
-
- Moons KGM, Kengne AP, Woodward M, Royston P, Vergouwe Y, Altman DG, Grobbee DE. Risk prediction models: I. Development, internal validation, and assessing the incremental value of a new (bio)marker. HEART 2012; 98(9):683–690. - PubMed
-
- D'Agostino RB, Vasan MJ RS and Pencina, Wolf PA, Cobain M, Massaro JM, Kannel WB. General cardiovascular risk profile for use in primary care: the Framingham Heart Study. Circulation; 117(1):743–53. - PubMed
Publication types
MeSH terms
Grants and funding
LinkOut - more resources
Full Text Sources
Other Literature Sources