

Review
doi: 10.1186/s12915-015-0201-x.
Structure and function of mitochondrial membrane protein complexes
Affiliations
- PMID: 26515107
- PMCID: PMC4625866
- DOI: 10.1186/s12915-015-0201-x
Item in Clipboard
Review
Structure and function of mitochondrial membrane protein complexes
BMC Biol.
.
Abstract
Biological energy conversion in mitochondria is carried out by the membrane protein complexes of the respiratory chain and the mitochondrial ATP synthase in the inner membrane cristae. Recent advances in electron cryomicroscopy have made possible new insights into the structural and functional arrangement of these complexes in the membrane, and how they change with age. This review places these advances in the context of what is already known, and discusses the fundamental questions that remain open but can now be approached.
Figures
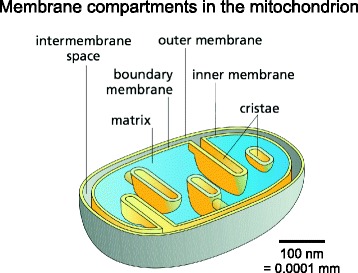
Membrane compartments in the mitochondrion. The outer membrane separates mitochondria from the cytoplasm. It surrounds the inner membrane, which separates the inter-membrane space from the protein-dense central matrix. The inner membrane is differentiated into the inner boundary membrane and the cristae. The two regions are continuous at the crista junctions. The cristae extend more or less deeply into the matrix and are the main sites of mitochondrial energy conversion. The shallow proton gradient between the inter-membrane space (pH 7.2–7.4) and the matrix (pH 7.9–8) drives ATP production by the ATP synthase in the membranes of the cristae. (Adapted from Figure 14–8 C in Alberts B. et al. Molecular Biology of the Cell. 6th ed. New York: Garland Science; 2014, with permission of the publisher [© 2015 from Molecular Biology of the Cell, Sixth Edition by Alberts et al. Reproduced by permission of Garland Science/Taylor & Francis Group LLC])
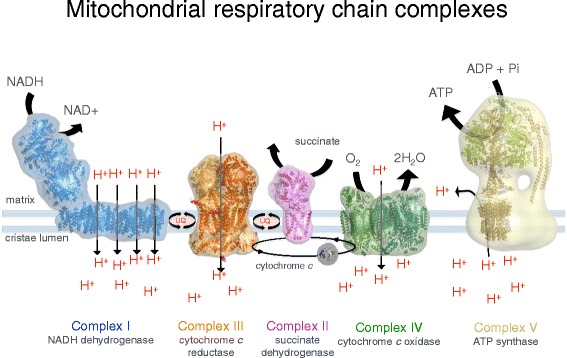
Membrane protein complexes of the respiratory chain. Electron transport complexes I (NADH/ubiquinone oxidoreductase, blue), II (succinate dehydrogenase, pink), III (cytochrome c reductase, orange), IV (cytochrome c oxidase, green) and the mitochondrial ATP synthase (also known as complex V, tan) work together in oxidative phosphorylation to harness energy for the cell. Complexes I, III and IV pump protons across the cristae membrane, creating the proton gradient that drives ATP synthesis. UQ ubiquinol. (Adapted from Davies KA, Daum B. Biochem. Soc. Trans. 2013;41:1227–34.)
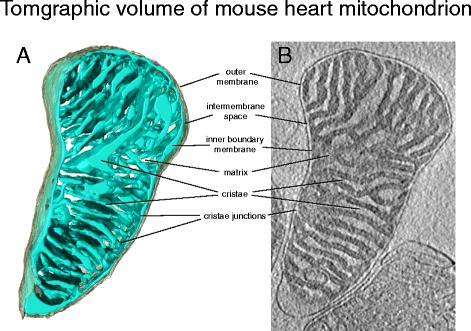
Tomographic volume of mouse heart mitochondrion. a Three-dimensional volume of a mouse heart mitochondrion determined by cryo-ET. The outer membrane (grey) envelops the inner membrane (light blue). The inner membrane is highly folded into lamellar cristae, which criss-cross the matrix. b Tomographic slice through the map volume. The dense matrix, which contains most of the mitochondrial protein, appears dark in the electron microscope, whereas the intermembrane space and crista lumen appear light because of their lower protein content. The inner boundary membrane follows the outer membrane closely at a distance of ~20 nm. The inner membrane turns sharply at the crista junctions, where the cristae join the inner boundary membrane. (Courtesy of Tobias Brandt)
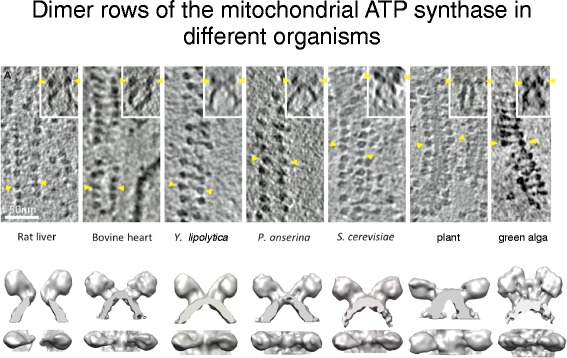
Double rows of ATP synthase in seven different species. Top row: slices of 3D volumes obtained by cryo-ET with rows of ATP synthase dimers. Insets show side views of the dimers in the membrane. Yellow arrowheads indicate F1 heads of one dimer. Scale bar = 50 nm. Bottom row: Surface representations of subtomogram averages. (Adapted from [17])
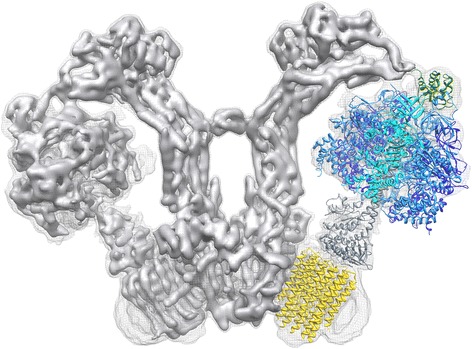
Structure of the mitochondrial ATP synthase dimer from Polytomella sp. Side view of the two mitochondrial ATP synthase in the V-shaped dimer. One protomer is fitted with atomic models PDB 2WSS [63] (α-subunits, cyan; β-subunits, blue; γδε subunits, grey; OSCP, green) and PDB 3U2Y [64] (yellow, c
10-ring). Density threshold levels are 1σ (mesh) or 7σ (solid surface). (Adapted from [40])
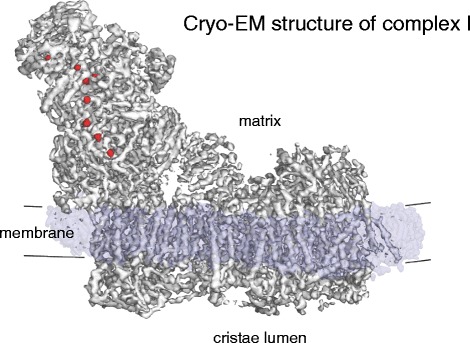
Cryo-EM structure of bovine heart complex I. Mitochondrial complex I (~1 MDa) has a matrix arm and a membrane arm. The matrix arm contains a row of eight iron-sulfur clusters (red) that conduct electrons from NADH to ubiquinol at the junction of the matrix and membrane arms (Fig. 7). The membrane arm consists of 78 trans-membrane helices, including three proton-pumping modules. (Adapted from [51]; EMDB code 2676)
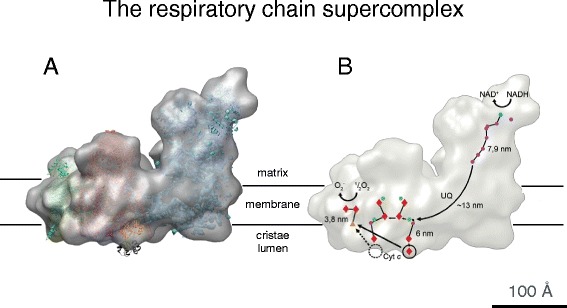
Cryo-EM structure of the 1.7 MDa bovine heart respiratory chain supercomplex. a The supercomplex consists of one copy of NADH dehydrogenase (complex I, blue), a cytochrome b-c
1 dimer (complex III, pink), and a single copy of cytochrome c oxidase (complex IV, green). b The ubiquinol (UQ) binding sites of complexes I and III and the short distance between the cytochrome c binding sites in complexes III and IV, which would favor efficient electron transfer. Cofactors active in electron transport are marked in yellow (FMN), orange (iron–sulfur clusters), dark blue (quinols), red (hemes), and green (copper atoms). Arrows indicate the electron path through the supercomplex. (Adapted from [51])
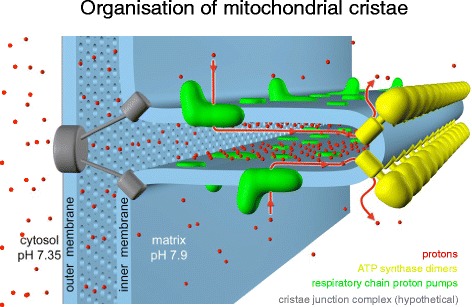
ATP synthase dimer rows shape the mitochondrial cristae. At the cristae ridges, the ATP synthases (yellow) form a sink for protons (red), while the proton pumps of the electron transport chain (green) are located in the membrane regions on either side of the dimer rows. Guiding the protons from their source to the proton sink at the ATP synthase, the cristae may work as proton conduits that enable efficient ATP production with the shallow pH gradient between cytosol and matrix. Red arrows show the direction of the proton flow. (Adapted from [17])
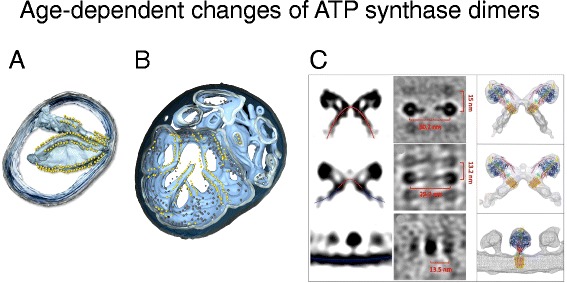
Changes of inner membrane morphology and ATP synthase dimers in ageing mitochondria. Tomographic volumes of mitochondria isolated from young (6-day-old) (a) and ageing (13-day-old) (b) cultures of the model organism Podospora anserina. In young mitochondria, the ATP synthase dimers are arranged in rows along highly curved inner membrane ridges (Movie S2). In ageing mitochondria, the cristae recede into the boundary membrane, with ATP synthases dimer rows along the shallow inner membrane ridges. Outer membrane, transparent grey; inner membrane, light blue. ATP synthase F1 heads are shown as yellow spheres. c Side and top views (left and centre) of subtomogram-averaged ATP synthase dimers from 6-day-old (top row), 9-day-old (centre), and 15-day-old P. anserina mitochondria. Right: subtomogram averages with fitted X-ray models. Red lines, convex membrane curvature (as seen from the matrix); blue lines, concave membrane curvature. (Adapted from [56])
References
Publication types
MeSH terms
Substances
LinkOut - more resources
Full Text Sources
Other Literature Sources
