. 2015 Nov 24;6(37):40186-201.
doi: 10.18632/oncotarget.5529.

Elucidating drivers of oral epithelial dysplasia formation and malignant transformation to cancer using RNAseq

Affiliations

Elucidating drivers of oral epithelial dysplasia formation and malignant transformation to cancer using RNAseq

Caroline Conway et al. Oncotarget. .

Abstract

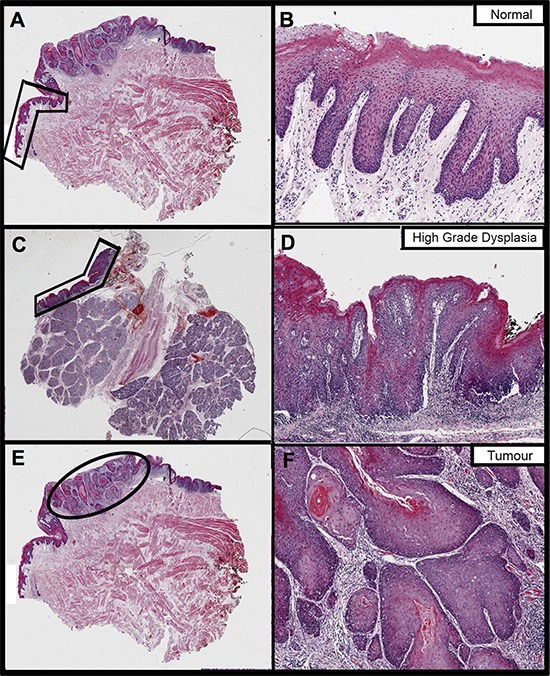
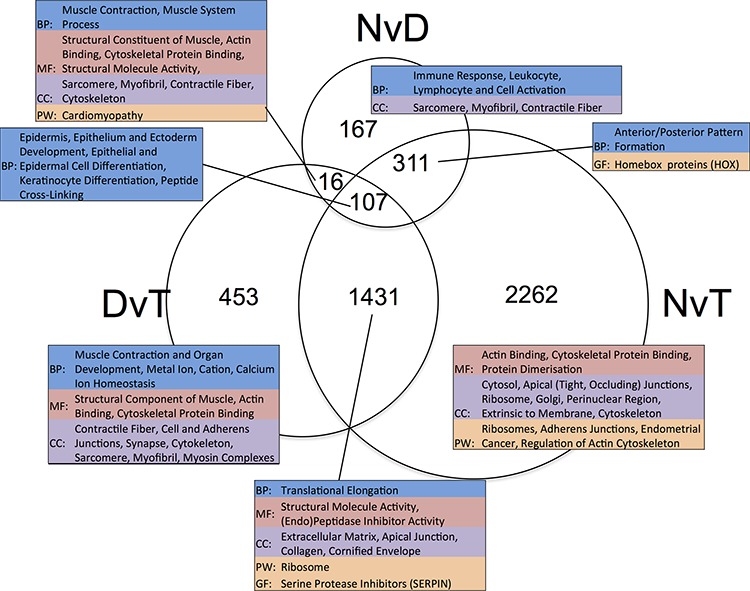
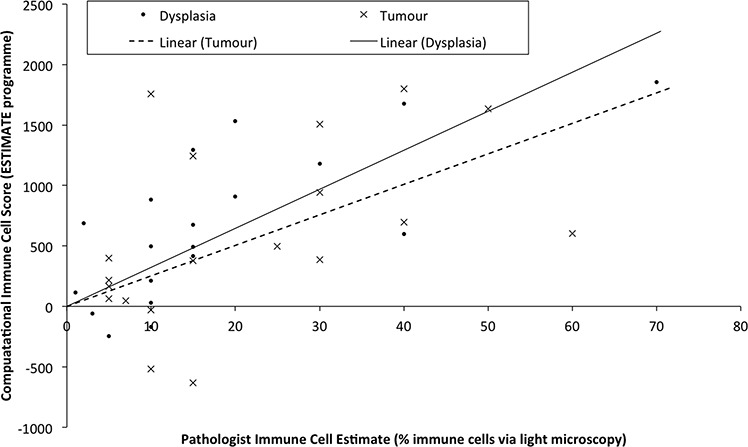
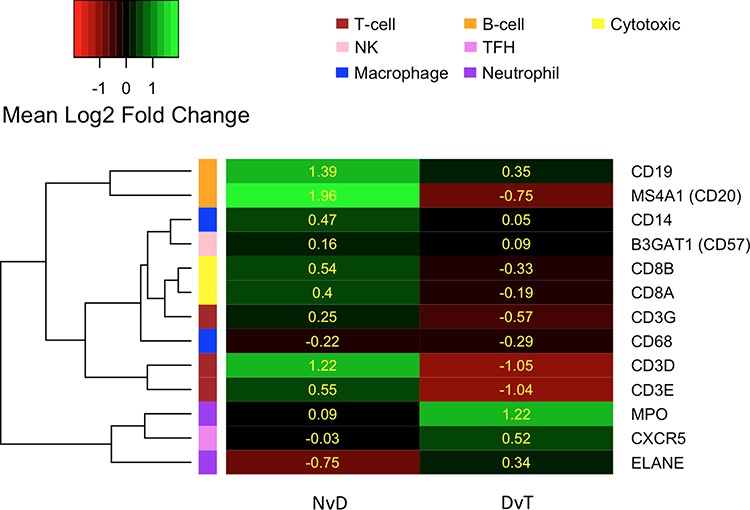
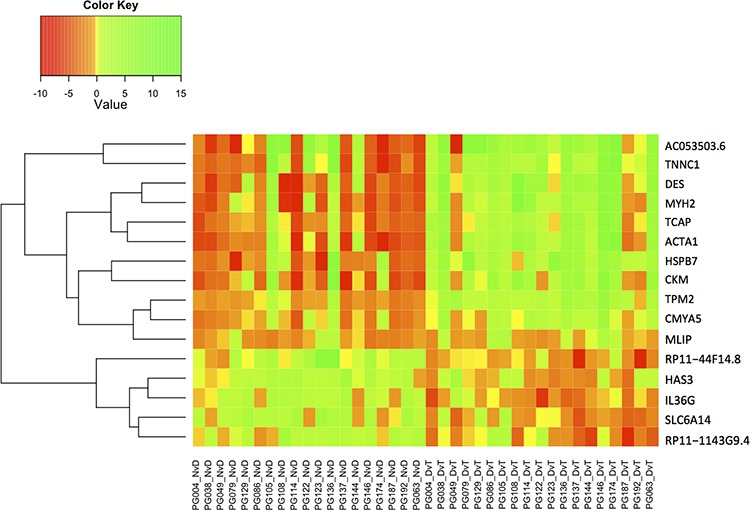
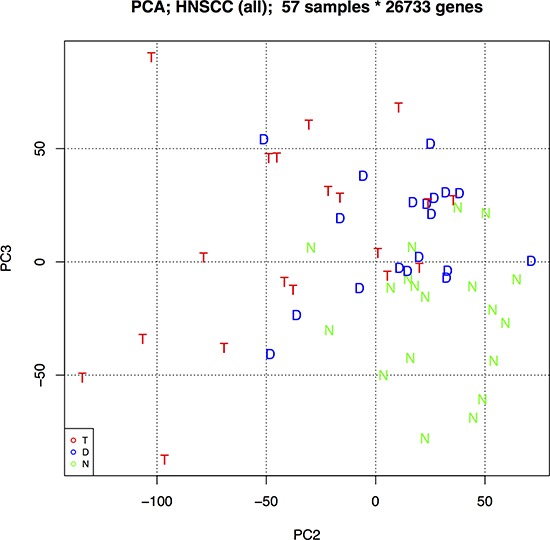
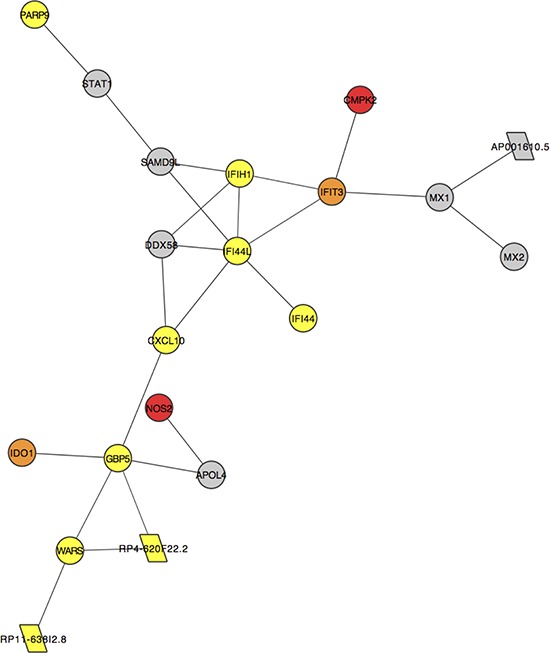
Oral squamous cell carcinoma (OSCC) is a prevalent cancer with poor prognosis. Most OSCC progresses via a non-malignant stage called dysplasia. Effective treatment of dysplasia prior to potential malignant transformation is an unmet clinical need. To identify markers of early disease, we performed RNA sequencing of 19 matched HPV negative patient trios: normal oral mucosa, dysplasia and associated OSCC. We performed differential gene expression, principal component and correlated gene network analysis using these data. We found differences in the immune cell signatures present at different disease stages and were able to distinguish early events in pathogenesis, such as upregulation of many HOX genes, from later events, such as down-regulation of adherens junctions. We herein highlight novel coding and non-coding candidates for involvement in oral dysplasia development and malignant transformation, and speculate on how our findings may guide further translational research into the treatment of oral dysplasia.

Keywords: OSCC; RNAseq; dysplasia; non-coding; oral squamous cell carcinoma.


Conflict of interest statement

CONFLICTS OF INTEREST

None to declare.

Figures

Figure 1
Figure 1. The fixed sections that were H&E stained and annotated to guide RNA extraction from a single patient (ID PG063) in this study
Images on the right are magnifications of the areas annotated on the left, to better show histology. Images A. and B. pertain to the normal oral mucosa sample, images C. and D. to dysplasia and images E. and F. to tumour. Normal and tumour were extracted from the same block whereas dysplasia is from a different block from the same surgery.
Figure 2
Figure 2. Venn diagram showing the overlap in lists of differentially expressed genes ascertained per pairwise, matched-sample comparison of our dataset
The numeric labels indicate the number of genes in each set. The tables highlight the significant (p < 0.05) functional enrichment within each subset according to gene ontology terms (BP: Biological Process, CC: Cellular Component and MF: Molecular Function), pathway (PW) analysis using Biocarta, KEGG and Panther, and gene family (GF) enrichment according to Panther. NvD: Normal versus Dysplasia. DvT: Dysplasia versus Tumour. NvT: Normal versus Tumour.
Figure 3
Figure 3. Samples are plotted according to the pathologist estimates of the percentage of immune cells within the macrodissected FFPE tissue (x-axis) versus the immune cell score derived computationally from the transcriptional profile
Linear regression lines for each tissue type are drawn separately as Linear (Tumour) or Linear (Dysplasia).
Figure 4
Figure 4. Heatmap indicating the average log2 fold change in expression (yellow values) of commonly used immunohistochemical markers for different immune cell types, as per the left hand colour key and top-right legend
Marker genes (row labels) are clustered according to their expression. NvD: Normal versus Dysplasia. DvT: Dysplasia versus Tumour
Figure 5
Figure 5. Heatmap indicating log2 fold change (Value) for the only 16 genes that are differentially expressed in both the NvD and DvT, but not the NvT pairwise comparison
NvD: Normal versus Dysplasia. DvT: Dysplasia versus Tumour. NvT: Normal versus Tumour.
Figure 6
Figure 6. Principal component analysis (PCA) biplot of PCs 2 and 3 using all protein-coding and non-coding genes
This biplot best separates the three oral sample groups: N – Normal epithelia, D – Dysplasia, and T – Tumour.
Figure 7
Figure 7. A subcluster of genes that are significantly positively correlated (correlation coefficient >0.95) across all samples in our data
Each node represents the labelled gene. Circular nodes indicate protein-coding genes. Parallelograms denote antisense genes. Colours indicate differential expression (DE) or lack thereof (grey) in our pairwise comparisons: yellow genes are DE NvD only, orange genes are DE NvD and NvT and red genes are DE NvD, DvT and NvT.

References

    1. Jemal A, Bray F, Center MM, Ferlay J, Ward E, Forman D. Global cancer statistics. CA: A Cancer Journal for Clinicians. 2011;61:69–90. - PubMed
    1. Califano J, van der Riet P, Westra W, Nawroz H, Clayman G, Piantadosi S, Corio R, Lee D, Greenberg B, Koch W, Sidransky D. Genetic Progression Model for Head and Neck Cancer: Implications for Field Cancerization. Cancer Research. 1996;56:2488–2492. - PubMed
    1. Guttman M, Amit I, Garber M, French C, Lin M, Feldser D, Huarte M, Zuk O, Carey B, Cassady J. Chromatin signature reveals over a thousand highly conserved large non-coding RNAs in mammals. Nature. 2009;458:223–227. - PMC - PubMed
    1. Yoshihara K, Shahmoradgoli M, Martinez E, Vegesna R, Kim H, Torres-Garcia W, Trevino V, Shen H, Laird PW, Levine DA, Carter SL, Getz G, Stemke-Hale K, Mills GB, Verhaak RGW. Inferring tumour purity and stromal and immune cell admixture from expression data. Nat Commun. 2013;4:2612. - PMC - PubMed
    1. Bindea G, Mlecnik B, Tosolini M, Kirilovsky A, Waldner M, Obenauf Anna C, Angell H, Fredriksen T, Lafontaine L, Berger A, Bruneval P, Fridman Wolf H, Becker C, Pagès F, Speicher Michael R, Trajanoski Z, et al. Spatiotemporal Dynamics of Intratumoral Immune Cells Reveal the Immune Landscape in Human Cancer. Immunity. 2013;39:782–795. - PubMed

Publication types

MeSH terms