. 2016 Feb;33(2):456-71.
doi: 10.1093/molbev/msv237. Epub 2015 Oct 29.

The Landscape of Realized Homologous Recombination in Pathogenic Bacteria

Affiliations

The Landscape of Realized Homologous Recombination in Pathogenic Bacteria

Koji Yahara et al. Mol Biol Evol. 2016 Feb.

Abstract

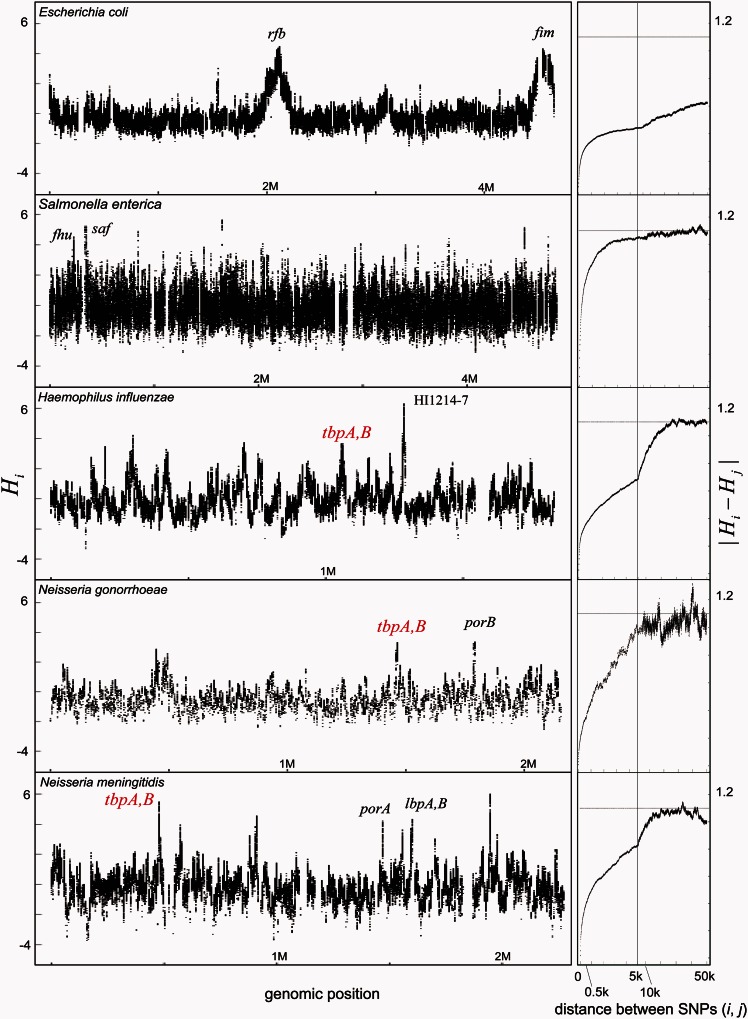
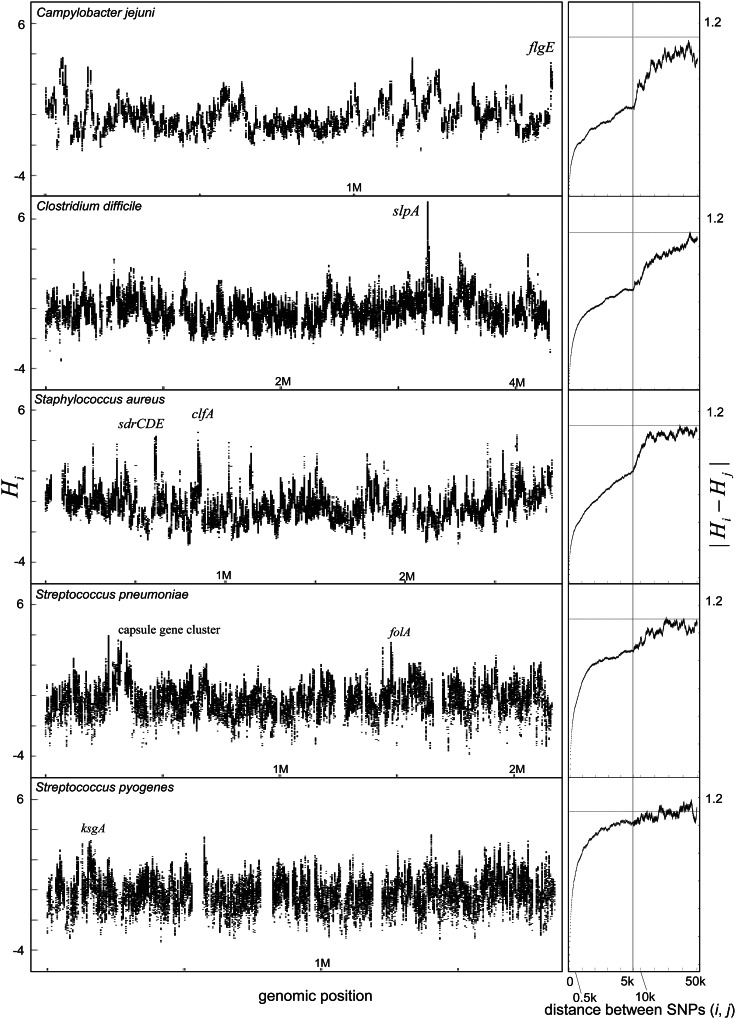
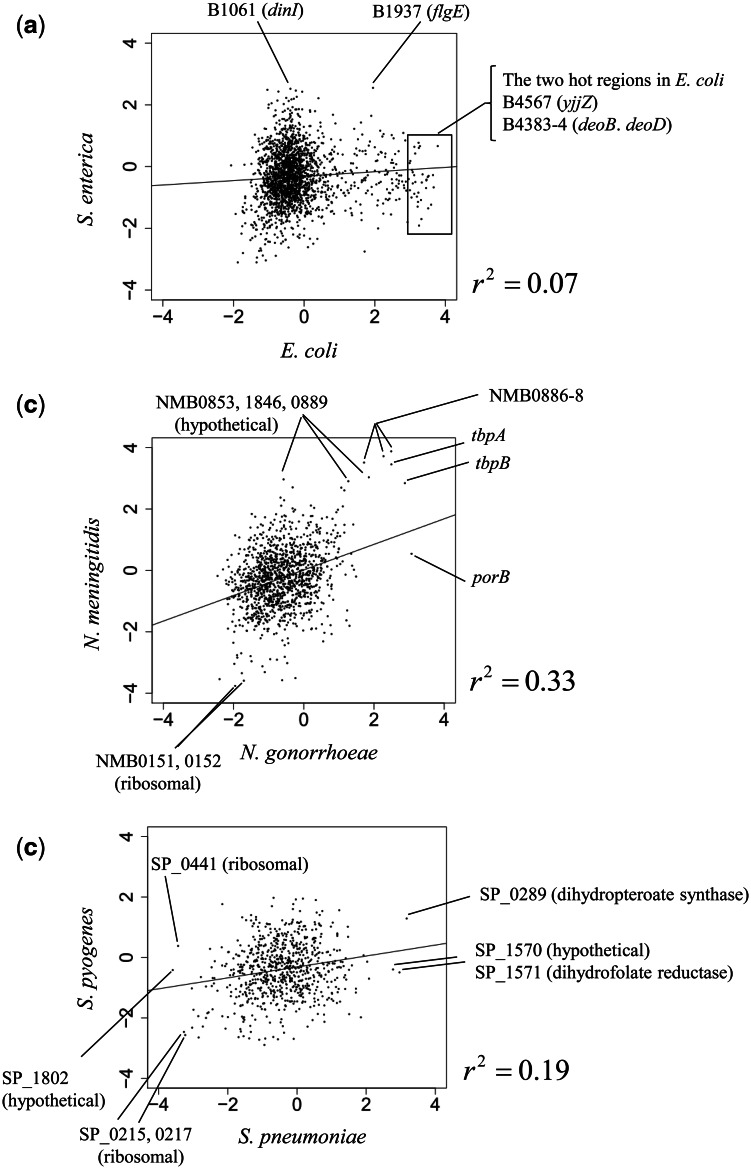
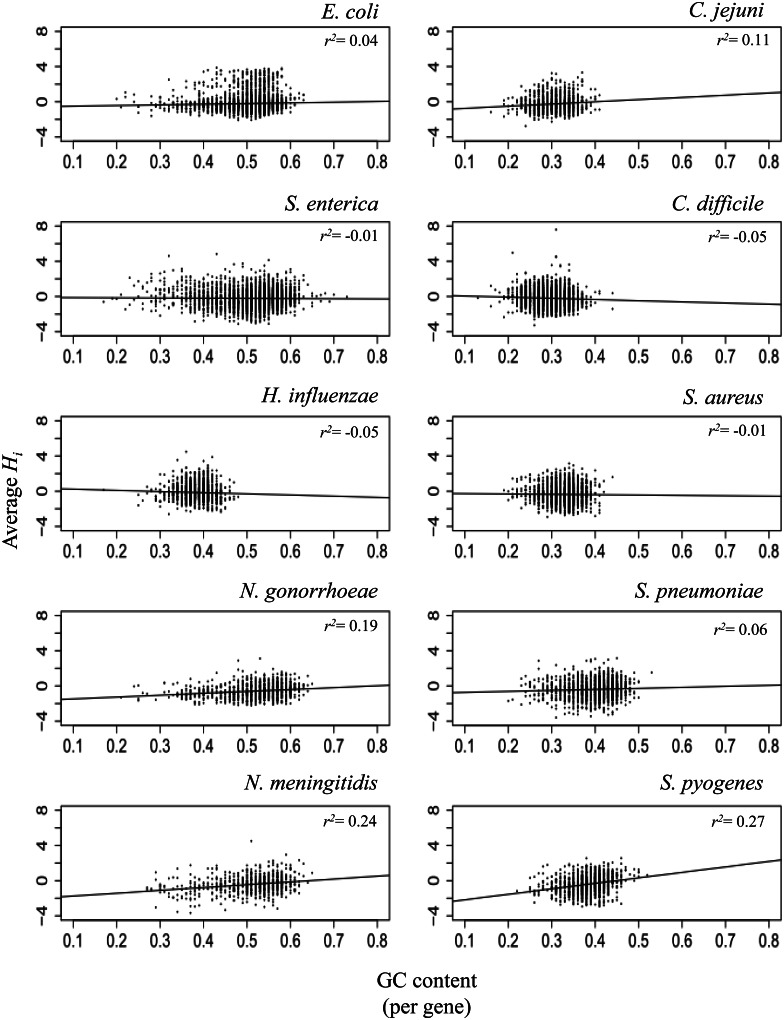
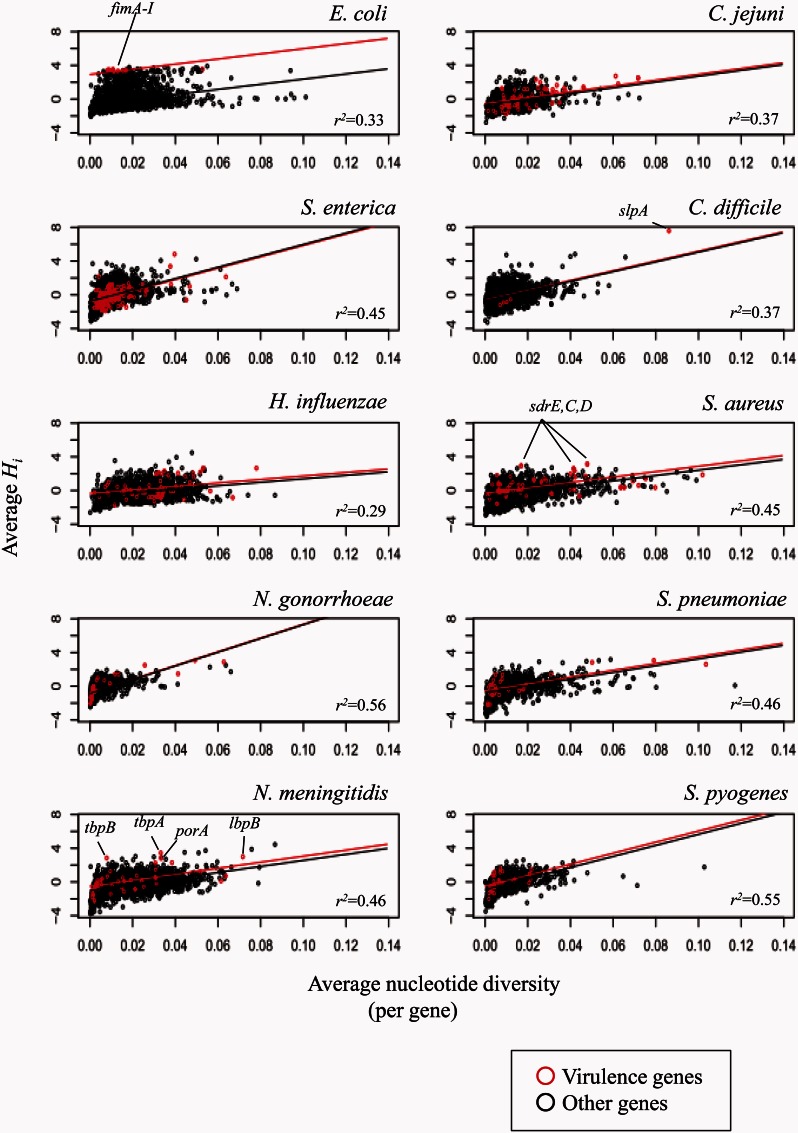
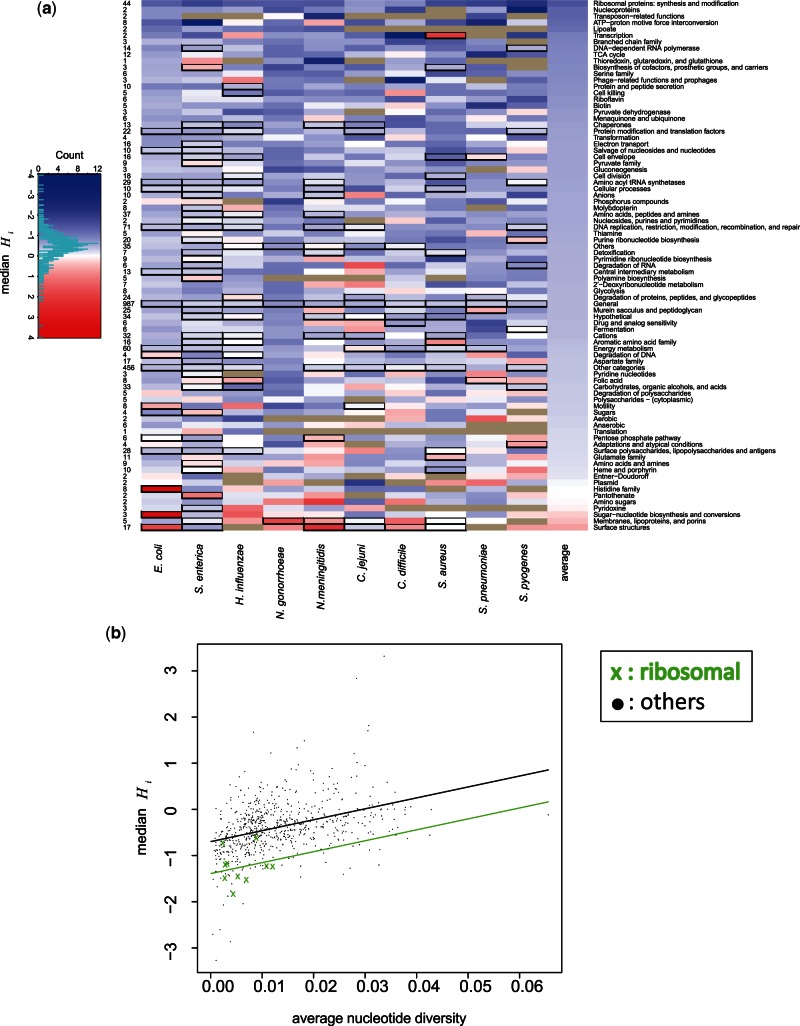
Recombination enhances the adaptive potential of organisms by allowing genetic variants to be tested on multiple genomic backgrounds. Its distribution in the genome can provide insight into the evolutionary forces that underlie traits, such as the emergence of pathogenicity. Here, we examined landscapes of realized homologous recombination of 500 genomes from ten bacterial species and found all species have "hot" regions with elevated rates relative to the genome average. We examined the size, gene content, and chromosomal features associated with these regions and the correlations between closely related species. The recombination landscape is variable and evolves rapidly. For example in Salmonella, only short regions of around 1 kb in length are hot whereas in the closely related species Escherichia coli, some hot regions exceed 100 kb, spanning many genes. Only Streptococcus pyogenes shows evidence for the positive correlation between GC content and recombination that has been reported for several eukaryotes. Genes with function related to the cell surface/membrane are often found in recombination hot regions but E. coli is the only species where genes annotated as "virulence associated" are consistently hotter. There is also evidence that some genes with "housekeeping" functions tend to be overrepresented in cold regions. For example, ribosomal proteins showed low recombination in all of the species. Among specific genes, transferrin-binding proteins are recombination hot in all three of the species in which they were found, and are subject to interspecies recombination.

Keywords: pathogenicity; population genomics; recombination; selection.


Figures

F<sc>ig</sc>. 1.
Fig. 1.
Landscapes of homologous recombination in bacterial species. Left: For each species, values of the per-site statistic (Hi) reflecting relative intensity of recombination at a site (nucleotide) are plotted along the reference genome of each species (supplementary table S1, Supplementary Material online). Some regions devoid of points indicate absence of SNPs for calculation of Hi because the alignment was not obtained in the regions. Locations of some recombination hot regions which are mentioned in the text or table 1 are indicated by letter. Right: Distance-dependence of the per-site statistic is shown in which x axis is distance between SNPs (i, j) and y axis is mean magnitude of the absolute difference of the Hi (normalized Di) and Hj.
F<sc>ig</sc>. 2.
Fig. 2.
Relation in intensity of recombination between closely related species. Each dot indicates an one-to-one orthologous gene shared between the species. X and Y axis indicate average values of Hi per orthologous gene in each species.
F<sc>ig</sc>. 3.
Fig. 3.
Broad-scale relation between GC content and Hi. Each dot corresponds to a gene. Y axis is average Hi per gene. Correlation coefficient (r2) is indicated.
F<sc>ig</sc>. 4.
Fig. 4.
Relationship between average nucleotide diversity and Hi per gene for the virulence genes and other genes in each species. Correlation coefficient (r2) is indicated. The regression lines compare levels of recombination in the virulence genes and other genes after controlling for the effect of nucleotide diversity.
F<sc>ig</sc>. 5.
Fig. 5.
(a) Relative intensity of recombination in each functional category in each species. Each cell indicates median of Hi. The rows are sorted by average of the medians of each category across the species (in the most right column). Cells circled by the black rectangles mean presence of a recombination hot gene in the categories. The numbers in the left indicate average number of genes in each category. Gray cells indicate absence of genes in a category of a species. (b) Low level of recombination in genes of ribosomal proteins compared with others across the ten species. Each orange x-mark (ribosomal) or black dot (others) corresponds to median of Hi of a functional category of a species in figure 5a. The regression lines show low level of recombination in genes of ribosomal proteins after controlling for the effect of nucleotide diversity.

References

    1. Adrian PV, Klugman KP. 1997. Mutations in the dihydrofolate reductase gene of trimethoprim-resistant isolates of Streptococcus pneumoniae. Antimicrob Agents Chemother. 41:2406–2413. - PMC - PubMed
    1. Angiuoli SV, Salzberg SL. 2011. Mugsy: fast multiple alignment of closely related whole genomes. Bioinformatics 27:334–342. - PMC - PubMed
    1. Auton A, Fledel-Alon A, Pfeifer S, Venn O, Segurel L, Street T, Leffler E M, Bowden R, Aneas I, Broxholme J, et al. 2012. A fine-scale chimpanzee genetic map from population sequencing. Science 336:193–198. - PMC - PubMed
    1. Baudat F, Buard J, Grey C, Fledel-Alon A, Ober C, Przeworski M, Coop G, de Massy B. 2010. PRDM9 is a major determinant of meiotic recombination hotspots in humans and mice. Science 327:836–840. - PMC - PubMed
    1. Bellanger X, Payot S, Leblond-Bourget N, Guedon G. 2014. Conjugative and mobilizable genomic islands in bacteria: evolution and diversity. FEMS Microbiol Rev 38:720–760. - PubMed

Publication types