. 2015 Oct 30;350(6260):558-63.
doi: 10.1126/science.aac6468.

Disease tolerance mediated by microbiome E. coli involves inflammasome and IGF-1 signaling

Affiliations

Disease tolerance mediated by microbiome E. coli involves inflammasome and IGF-1 signaling

Alexandria M Palaferri Schieber et al. Science. .

Abstract

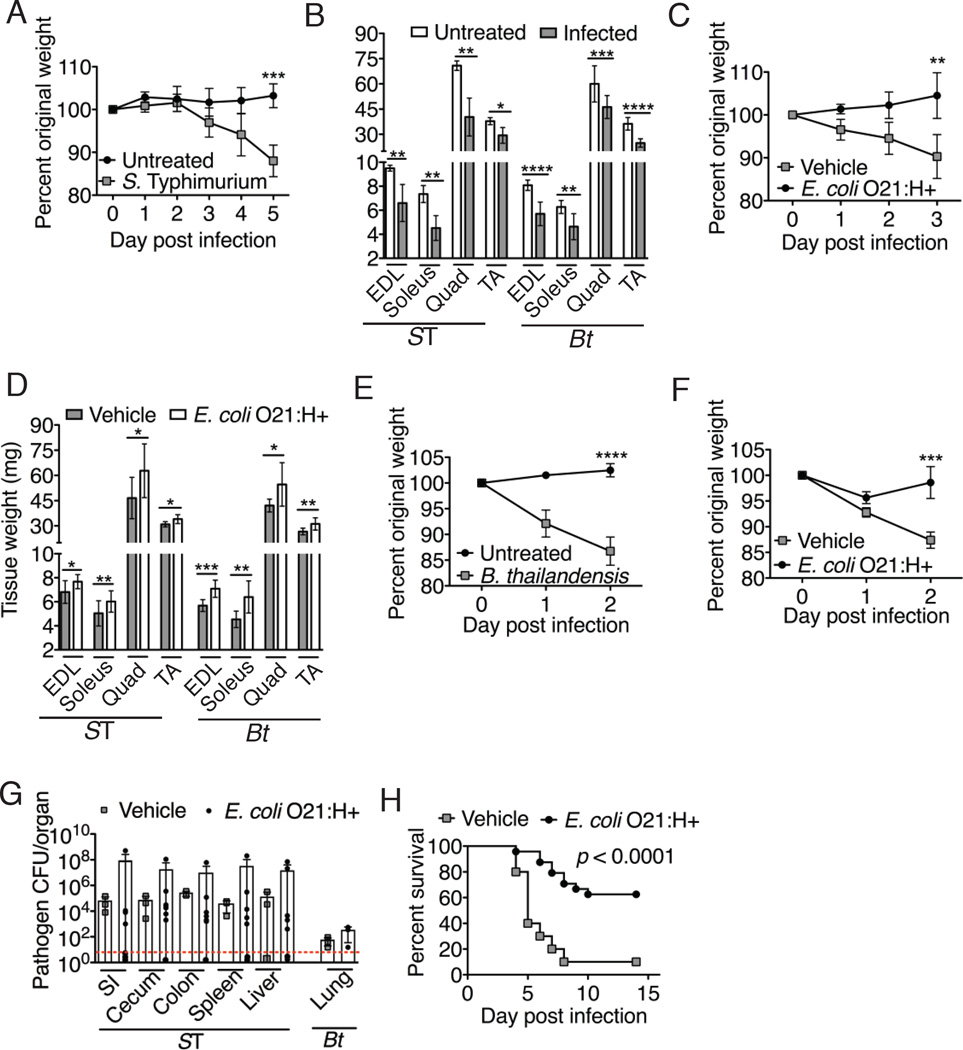
Infections and inflammation can lead to cachexia and wasting of skeletal muscle and fat tissue by as yet poorly understood mechanisms. We observed that gut colonization of mice by a strain of Escherichia coli prevents wasting triggered by infections or physical damage to the intestine. During intestinal infection with the pathogen Salmonella Typhimurium or pneumonic infection with Burkholderia thailandensis, the presence of this E. coli did not alter changes in host metabolism, caloric uptake, or inflammation but instead sustained signaling of the insulin-like growth factor 1/phosphatidylinositol 3-kinase/AKT pathway in skeletal muscle, which is required for prevention of muscle wasting. This effect was dependent on engagement of the NLRC4 inflammasome. Therefore, this commensal promotes tolerance to diverse diseases.


Conflict of interest statement

The authors declare no conflict of interest.

Figures

Fig. 1
Fig. 1. Effects of E. coli O21:H+ on DSS-induced skeletal muscle atrophy
(A–B) Jax mice were treated with 5% DSS. (A) Percent original weight. (B) Leg muscle mass at 7-days. Representative experiment (N = 4–6) using 5 animals per group, mean +/− S.D. Unpaired t-test. (C) Percent original weight of colony born C57Bl/6 mice (UC Berekely) treated with ampicillin, vancomycin, neomycin, metronidazole and 5% DSS (methods). Representative experiment (N = 3) using 4 animals per group, mean +/− S.D. Unpaired t-test. (D) Percent original weight of 5% DSS-treated Jax mice gavaged with 5×10⁸ CFU E. coli O21:H+ or vehicle (methods). Representative experiment (N = 6) using 4 animals per group, mean +/− S.D. Unpaired t-test. Fig. S3 shows untreated control mice +/− E. coli O21:H+. (E–F) Germ free Swiss Webster (SW) mice gavaged with 5×10⁸ E. coli O21:H+ or E. coli MG1655 (methods) and treated with 5% DSS. (E) Percent original weight. (F) Leg muscle mass at 5-days from a subset of mice in (E) that were weight matched at Day 0. Representative experiment (N = 4) using 5–7 animals per group, mean +/− S.D. Unpaired t-test. Fig. S3 shows monocolonized SW controls. (G) Percent survival of Jax mice administered E. coli O21:H+ or heat-killed E. coli O21:H+ (methods) and treated with 5% DSS for 7-days, after which DSS was no longer administered. Results are from two independent experiments using 4–7 mice per group per experiment. Log rank analysis. Survival analyses of untreated control +/− E. coli O21:H+ mice have been carried out for one year with no deaths from either group. Vehicle/DSS treated mice exhibit similar death kinetics as heat-killed/DSS treated mice. **** p < 0.0001, *** p < 0.0005, ** p < 0.005, * p < 0.05. EDL = extensor digitorum longus, TA = tibialis anterior. Experiments terminated for postmortem analyses at indicated day when one or more mice lost (A, B, D, E, F) >15% body weight in accordance with our Salk animal protocol or (C) >20% weight loss in accordance with our animal protocol (Berkeley).
Fig. 2
Fig. 2. Effects of E. coli O21:H+ colonization on muscle wasting induced by infections
(A) Percent original weight of Jax mice orally infected with 8.5×10⁶ S. Typhimurium. Representative experiment (N = 3) using 5 animals per group, mean +/− S.D. Unpaired t-test. (B) Leg muscle mass from S. Typhimurium-infected mice in (A) at Day 5(ST) or B. thailandensis-infected mice in (E) at Day 2 (Bt). Representative experiment (N = 3) using 5 animals per group, shown as mean +/− S.D. Unpaired t-test. (C) Percent original weight of Jax mice gavaged with 5×10⁸ CFU E. coli O21:H+ or vehicle and orally infected with 2×10⁷ S. Typhimurium. Representative experiment (N = 7) using 4–5 animals per group, mean +/− S.D. Unpaired t-test. Fig. S3 shows untreated control mice +/− E. coli O21:H+. (D) Leg muscle mass from infected E. coli O21:H+ or vehicle mice from (C) at Day 3 (ST) and from (F) at Day 2 (Bt). Representative experiment (N = 3–7) using 4–5 animals per group, mean +/− S.D. Unpaired t-test. Fig. S3 shows control mice +/− E. coli O21:H+. (E–F) Jax mice were (E) left untreated or (F) gavaged with 5×10⁸ CFU E. coli O21:H+ or vehicle (methods) and intranasally infected with 2500 CFU B. thailandensis. Representative experiment (N = 3–7) using 4–5 animals per group, shown as mean +/− S.D. Unpaired t-test. (G) S. Typhimurium (2×10⁷ CFU inoculum) or B. thailandensis (2500 CFU inoculum) burdens in target tissues from infected mice +/− E. coli O21:H+ at 3-day (ST) or 2-day (Bt). B. thailandensis was not detected in the liver and spleen at this dose. Representative experiment (N = 3–7) using 3–7 animals per group, mean +/− S.D. Unpaired t-test. Dotted line indicates limit of detection. (H) Percent survival of Jax mice treated with 5×10⁸ CFU E. coli O21:H+ or vehicle orally infected with 2×10⁷ S. Typhimurium. Results are from two independent experiments with 10–12 animals per group per experiment. Log rank analysis. ****p < 0.0001 *** p < 0.0005, ** p < 0.005, * p < 0.05. Postmortem analyses at day when one or more mice lost >15% body weight. EDL = extensor digitorum longus, TA = tibialis anterior.
Fig. 3
Fig. 3. Gut colonisation by E. coli O21:H+ associated with down-regulation of muscle atrophy programs and maintenance of IGF-1 signaling during infection
(A–B) Jax mice gavaged with 5×10⁸ CFU E. coli O21:H+ or vehicle and intranasally infected with 1000 CFU B. thailandensis. (A) Murf1 and Atrogin-1 expression in leg muscle at 2-day postinfection normalized to ribosomal protein S17 (RPS17) expression. Representative experiment (N =3) using 4–9 animals per group, mean +/− S.D. ANOVA. (B) Serum IGF-1 at 2-days. Representative experiment (N = 3) using 7–9 animals per group, shown as mean +/− S.D. ANOVA. See Fig. S14 for additional controls. (C–D) Jax mice were given 5×10⁸ CFU E. coli O21:H+ or vehicle and intranasally infected with 2500 CFU B. thailandensis. (C) IGF-1 levels in WAT and (D) E. coli O21:H+ levels in the WAT at Day 2. Representative experiment (N = 4) using 6–10 animals per group, mean +/− S.D. ANOVA. Red line = limit of detection. (E–H) Mice given 5×10⁸ CFU E. coli O21:H+ or vehicle were injected i.p. with anti-IGF-1 or IgG isotype control antibody and intranasally infected with 1000 CFU B. thailandensis. (E) Percent original weight. Results are from two independent experiments using 6–9 mice per group per experiment (12–17 mice total), mean +/− S.D. ANOVA. Fig. S14 for additional controls. (F) Leg muscle mass and (G) Adipose tissue mass at 2-days. EDL = extensor digitorum longus, TA = tibialis anterior. GWAT = gonadal white adipose tissue, RPWAT = retroperitoneal WAT, IWAT = inguinal WAT, BAT = brown adipose tissue. Results are from the two independent experiments described in (E) using 5–9 mice weight matched at day 0 (~18g) for each group for each experiment (10–14 mice total), mean +/− S.D. ANOVA. (H) Murf1 and Atrogin-1 expression in leg muscle at 2-day and normalized to RPS17. Representative experiment (N = 2) using 5–9 animals per group, mean +/− S.D. ANOVA. ****p < 0.0001, ***p = 0.0006, **p < 0.005, *p < 0.05. Postmortem analyses at day when one or more mice lost >15% body weight.
Fig. 4
Fig. 4. The Nlrc4 inflammasome is required for sustaining IGF-1 levels and mediates the E. coli O21:H+ associated protection against muscle wasting promoted by pathogenic infection
(A–C) Wild-type and Casp1−/−11−/− mice were administered 5×10⁸ CFU E. coli O21:H+ or vehicle and then intranasally infected with 2500 CFU B. thailandensis as described in methods. (A) Percent original weight at day 2. See Fig. S3 for additional controls. (B) Expression of Murf1 and Atrogin-1 were determined in leg muscle at 2-day postinfection normalized to expression levels of RPS17. (C) Serum IGF-1 quantified at day 2. Representative experiment (N = 3) using 10 animals per wildtype group and 5–7 mice per Casp1−/−11−/− group, mean +/− S.D. ANOVA. (D) Wild-type and Nlrc4−/− mice were given 5×10⁸ CFU E. coli O21:H+ or vehicle and infected intranasally with 2500 CFU B. thailandensis. Serum levels of IGF-1 at 2-days postinfection were measured. Representative experiment (N = 2) using 10 animals per wildtype group and 5 mice per Nlrc4−/− group, shown as mean +/− S.D. ANOVA. (E) Jax mice were given with 5×10⁸ CFU E. coli O21:H+ or vehicle and then intranasally infected with 2500 CFU B. thailandensis as described in Methods and serum IL-18 levels were measured at 2-days postinfection. Representative experiment (N = 2) using 10 animals per group, mean +/− S.D. ANOVA. (F) Wild-type and Il1β−/−Il18−/− mice were administered 5×10⁸ CFU E. coli O21:H+ or vehicle and then intranasally infected with 2500 CFU B. thailandensis. Serum levels of IGF-1 at 2-days postinfection were measured. Representative experiment (N = 3) using 10 animals per wildtype group and 8 mice per Il1β−/−Il18−/− group, mean +/− S.D. ANOVA. ***p < 0.0003, **p < 0.006, *p < 0.05. Experiment was terminated at 2-days for postmortem analyses when one or more mice lost >15% body weight in accordance with our Salk animal protocol. (C, D, F) see Fig. S14 for additional controls.

Comment in

References

    1. Delano MJ, Moldawer LL. The origins of cachexia in acute and chronic inflammatory diseases. Nutrition in clinical practice : official publication of the American Society for Parenteral and Enteral Nutrition. 2006;21:68–81. - PubMed
    1. Fearon K, et al. Definition and classification of cancer cachexia: an international consensus. The Lancet. Oncology. 2011;12:489–495. - PubMed
    1. Villamor E, et al. Wasting and body composition of adults with pulmonary tuberculosis in relation to HIV-1 coinfection, socioeconomic status, and severity of tuberculosis. European journal of clinical nutrition. 2006;60:163–171. - PubMed
    1. Hasselgren PO. Catabolic response to stress and injury: implications for regulation. World journal of surgery. 2000;24:1452–1459. - PubMed
    1. Kalantar-Zadeh K, et al. Why cachexia kills: examining the causality of poor outcomes in wasting conditions. J Cachexia Sarcopenia Muscle. 2013;4:89–94. - PMC - PubMed

Publication types

MeSH terms

LinkOut - more resources