. 2015 Oct 30;11(10):e1004519.
doi: 10.1371/journal.pcbi.1004519. eCollection 2015 Oct.

Doubly Bayesian Analysis of Confidence in Perceptual Decision-Making

Affiliations

Doubly Bayesian Analysis of Confidence in Perceptual Decision-Making

Laurence Aitchison et al. PLoS Comput Biol. .

Abstract

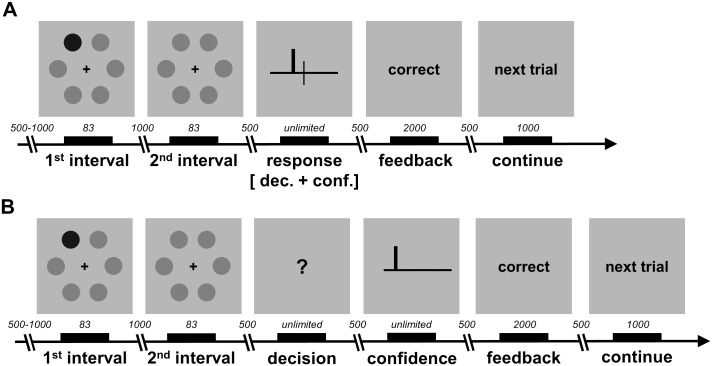
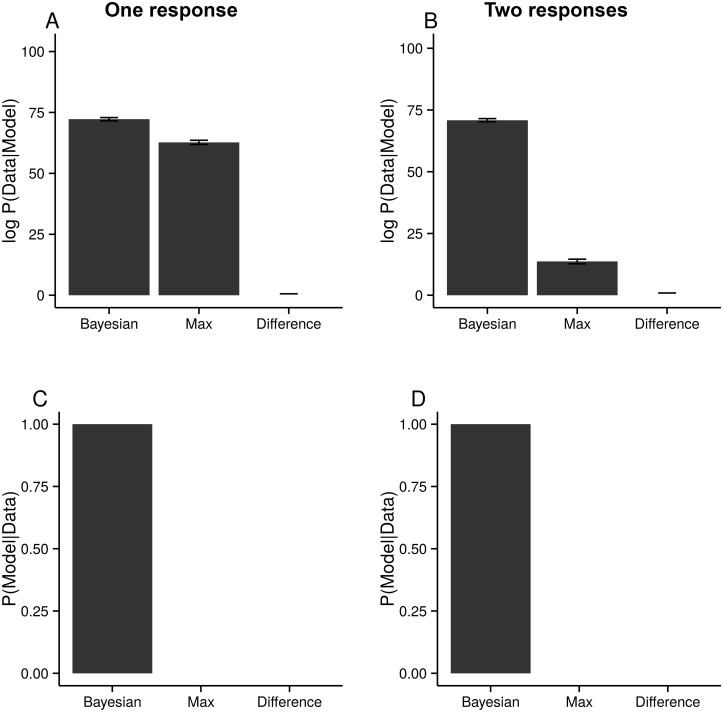
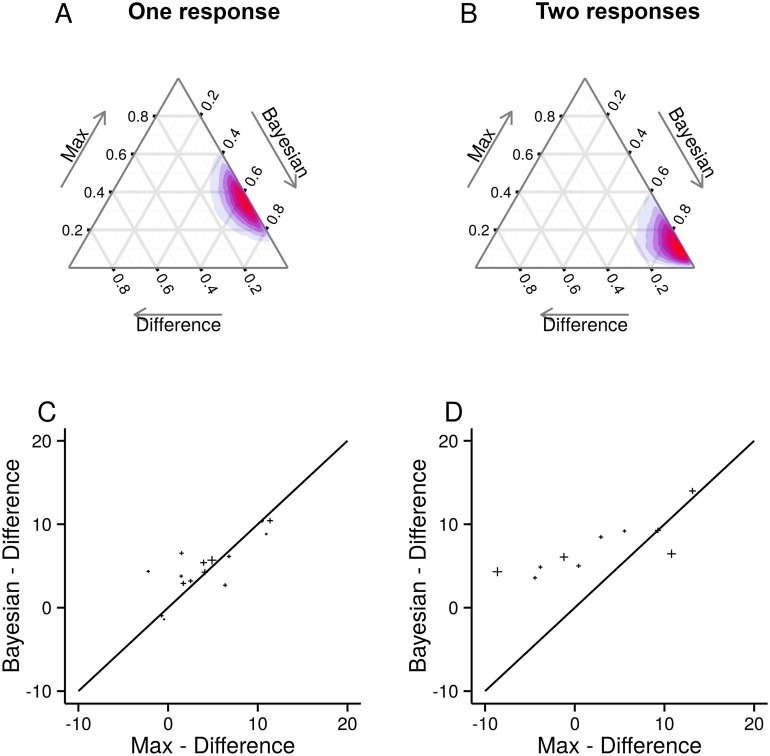
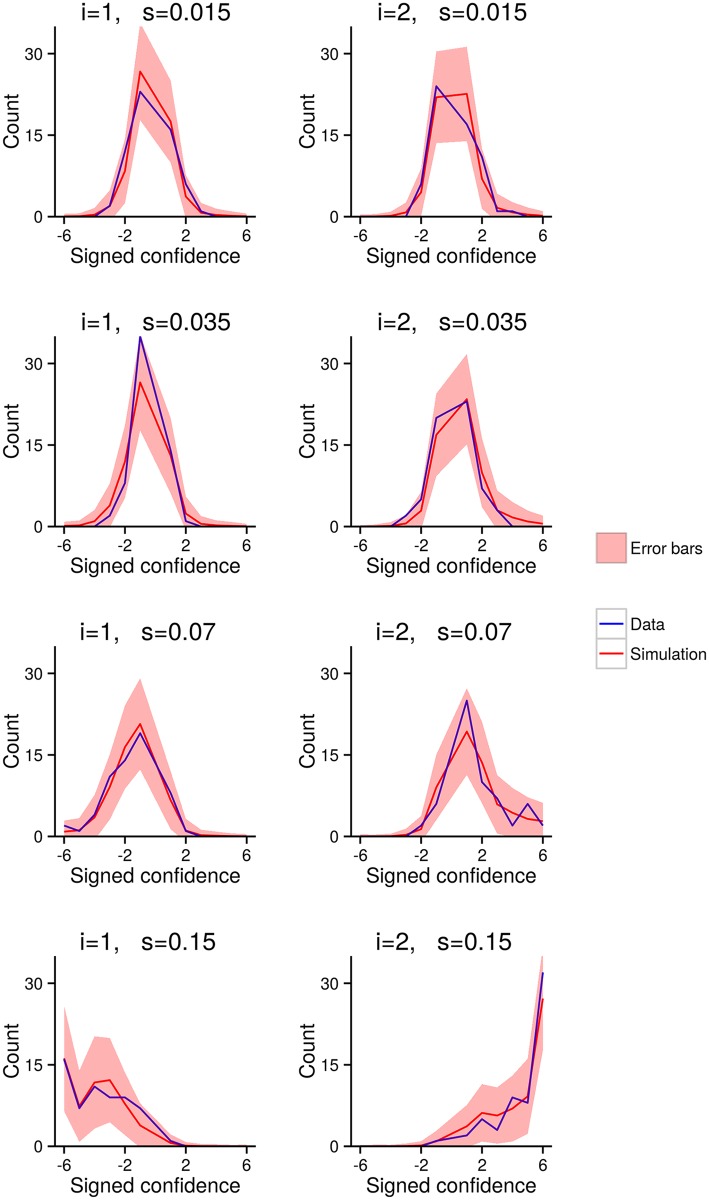
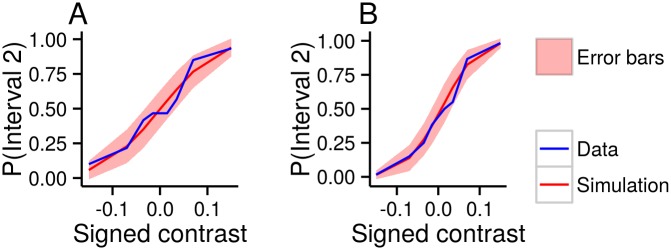
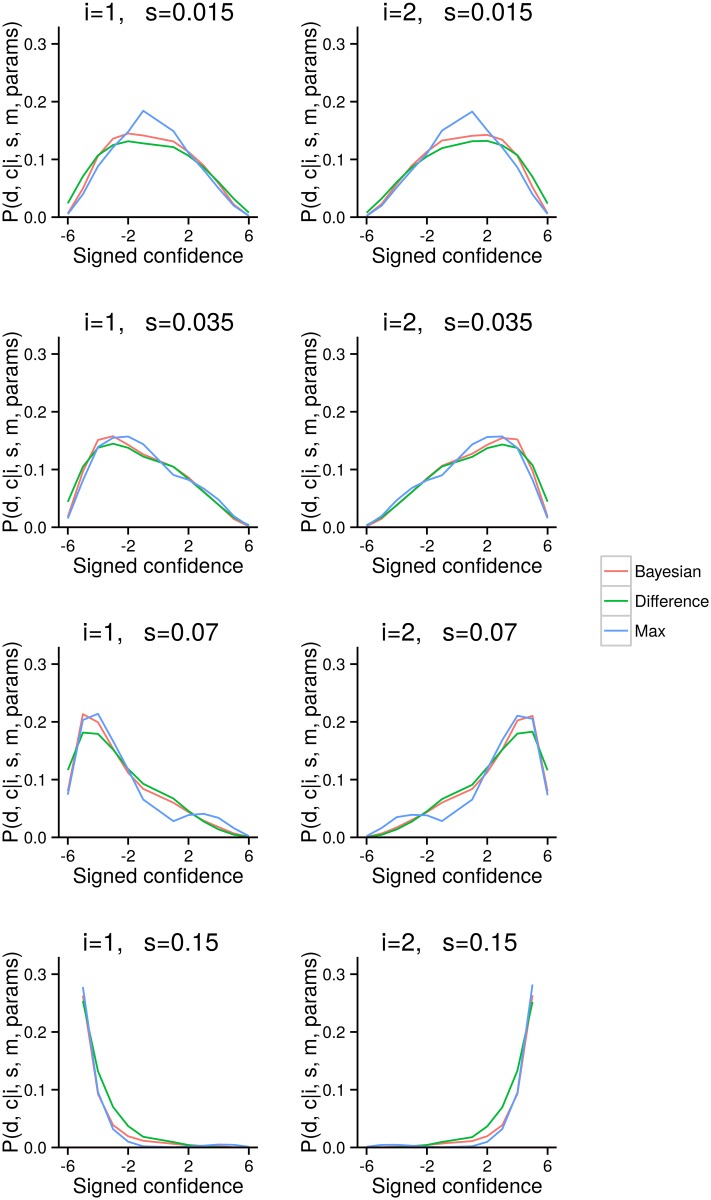
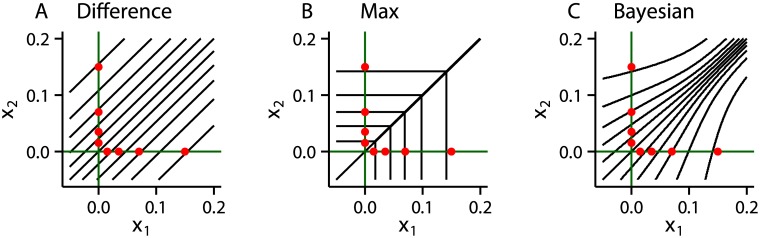
Humans stand out from other animals in that they are able to explicitly report on the reliability of their internal operations. This ability, which is known as metacognition, is typically studied by asking people to report their confidence in the correctness of some decision. However, the computations underlying confidence reports remain unclear. In this paper, we present a fully Bayesian method for directly comparing models of confidence. Using a visual two-interval forced-choice task, we tested whether confidence reports reflect heuristic computations (e.g. the magnitude of sensory data) or Bayes optimal ones (i.e. how likely a decision is to be correct given the sensory data). In a standard design in which subjects were first asked to make a decision, and only then gave their confidence, subjects were mostly Bayes optimal. In contrast, in a less-commonly used design in which subjects indicated their confidence and decision simultaneously, they were roughly equally likely to use the Bayes optimal strategy or to use a heuristic but suboptimal strategy. Our results suggest that, while people's confidence reports can reflect Bayes optimal computations, even a small unusual twist or additional element of complexity can prevent optimality.


Conflict of interest statement

The authors have declared that no competing interests exist.

Figures

Fig 1
Fig 1. For one-dimensional sensory data, x, any monotonic transformation, z(x), can give the same mapping from x to c.
The best we, as experimenters, can do is to determine the mapping from x to c, which, for discrete mappings, corresponds to a set of thresholds (the vertical lines). We can, however, get the same mapping from x to c by first transforming x to z (the curved black line), then thresholding z. The relevant thresholds are simply given by passing the x-thresholds through z(x) (giving the horizontal lines). Therefore, there is no way to determine the “right” z(x)—any z(x) will fit the data (as long as z(x) is a strictly monotonic function of x).
Fig 2
Fig 2. Schematic of experimental design and task.
A One-response design. Participants indicated their decision and their confidence simultaneously. B Two-response design. Participants indicated their decision and their confidence sequentially. The displays have been edited for ease of illustration (e.g. Gabor patches are shown as dots, with the visual target being the darker dot). All timings are shown in milliseconds. See text for details.
Fig 3
Fig 3. Schematic diagram of our method for mapping thresholds to confidence probabilities.
The lower panel displays the (fixed) distribution over z C, P(z Cd, m, σ, b) (which does not depend on the thresholds). The left panel displays the distribution over confidence reports, determined by p. The large central panel displays the fitted function mapping from z C to c, which consists of a set of jumps, with each jump corresponding to a threshold. The thresholds are chosen so that the total probability density in P(z Cd, m, σ, b) between jumps is exactly equal to the probability of the corresponding confidence level (see colours).
Fig 4
Fig 4. The probability of the three models given the data.
AB The log-likelihood differences between the models, using the Difference model as a baseline. Note the small error bars, representing two standard-errors, given by running the algorithm 10 times, and each time using 1000 samples to estimate the model evidence (Eq (25)). CD The posterior probability of the models, assuming a uniform prior. Left column, one response. Right column, two responses.
Fig 5
Fig 5. Single-subject analysis.
AB Subjects are assumed to use each model with some probability. The coloured regions represent plausible settings for these probabilities. For the one-response dataset, we see that subjects are roughly equally likely to use the Max and Bayesian models. For the two-responses dataset, we see that subjects are far more likely to use the Bayesian model. To read these plots, follow the grid lines in the same direction as axis ticks and labels, so for instance, lines of equal probability for the Max model run horizontally, and lines of equal probability for the Bayesian model run up and to the right. CD The difference in log-likelihood between the Bayesian model and the Difference model (on the y-axis) against the difference in log-likelihood between the Max model and Difference model (on the x-axis). The size of the crosses represents the uncertainty (two standard errors) along each axis (based on the 10 runs of the model selection procedure, mentioned in Fig 4).
Fig 6
Fig 6. Simulated (Bayesian model) and actual confidence distributions for one subject (one response), and each target interval and contrast.
The plots on the left are for targets in interval 1 (i.e. i = 1), whereas the plots on the right are for targets in interval 2 (i.e. i = 2). We use signed confidence on the horizontal axis (the sign indicates the decision, and the absolute value indicates the confidence level). The blue line is the empirically measured confidence distribution. The red line is Bayesian model’s fitted confidence distribution. The red area is the region around the fitted mean confidence distribution that we expect the data to lie within. We computed the error bars by sampling settings for the model parameters, then sampling datasets conditioned on those parameters. The error bars represent two standard deviations of those samples. This plot demonstrates that the Bayesian model is, at least, plausible.
Fig 7
Fig 7. Simulated (Bayesian model) and actual psychometric curves for two subjects.
The horizontal axis displays signed contrast (the sign gives the target interval, and the absolute value gives the contrast level). Colour code is the same as in Fig 6: the blue line is the empirically measured psychometric curve; the red line is the Bayesian model’s fitted mean psychometric curve; and the red area represents Bayesian error bars. A One subject from the one-response design. B One subject from the two-response design. As with Fig 6, this plot demonstrates the plausibility of the Bayesian model.
Fig 8
Fig 8. Different models lead to different distributions over confidence.
Same as Fig 6, but displaying theoretical distributions induced by the three different models. The parameters were not fit to data; instead, they were set to fixed (but reasonable) values: σ = 0.07, b = 0 and p d, c = 1/12.
Fig 9
Fig 9. The mapping from stimulus-space to confidence induced by different models.
The axes represent the two stimulus dimensions (cf. interval 1 and 2). The red dots represent the mean values of x 1 and x 2 for each stimulus. The black lines separate regions in stimulus space that map to a given confidence level. A Difference model. B Max model. C Bayesian model. The model parameters are the same as in Fig 8.

References

    1. Kepecs A, Uchida N, Zariwala HA, Mainen ZF. Neural correlates, computation and behavioral impact of decision confidence. Nature. 2008;455 (7210). 10.1038/nature07200 - DOI - PubMed
    1. Kiani R, Shadlen MN. Representation of confidence associated with a decision by neurons in the parietal cortex. Science. 2009;324 (5928). 10.1126/science.1169405 - DOI - PMC - PubMed
    1. Komura Y, Nikkuni A, Hirashima N, Uetake T, Miyamoto A. Responses of pulvinar neurons reflect a subject’s confidence in visual categorization. Nature Neuroscience. 2013;16(6). 10.1038/nn.3393 - DOI - PubMed
    1. Bahrami B, Olsen K, Latham PE, Roepstorff A, Rees G, Frith CD. Optimally interacting minds. Science. 2010;329 (5995). 10.1126/science.1185718 - DOI - PMC - PubMed
    1. Fusaroli R, Bahrami B, Olsen K, Roepstorff A, Rees G, Frith C, et al. Coming to terms: quantifying the benefits of linguistic coordination. Psychological Science. 2012;23(8). 10.1177/0956797612436816 - DOI - PubMed

Publication types

LinkOut - more resources