. 2015 Oct 30;10(10):e0140134.
doi: 10.1371/journal.pone.0140134. eCollection 2015.

Reproducibility and Temporal Structure in Weekly Resting-State fMRI over a Period of 3.5 Years

Affiliations

Reproducibility and Temporal Structure in Weekly Resting-State fMRI over a Period of 3.5 Years

Ann S Choe et al. PLoS One. .

Abstract

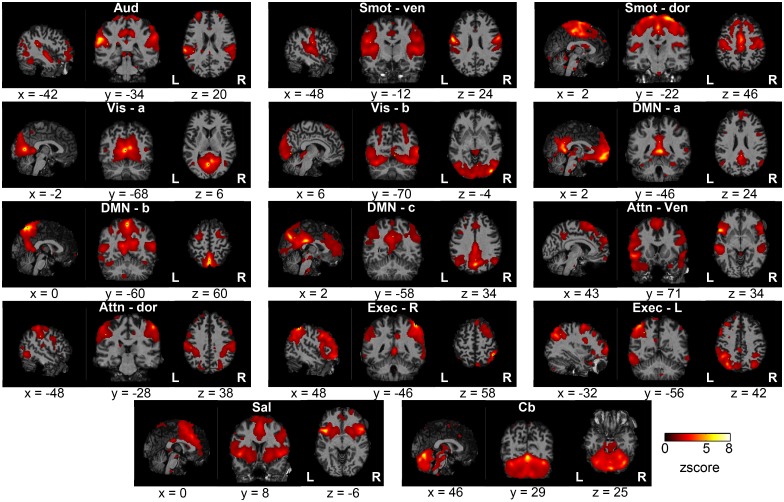
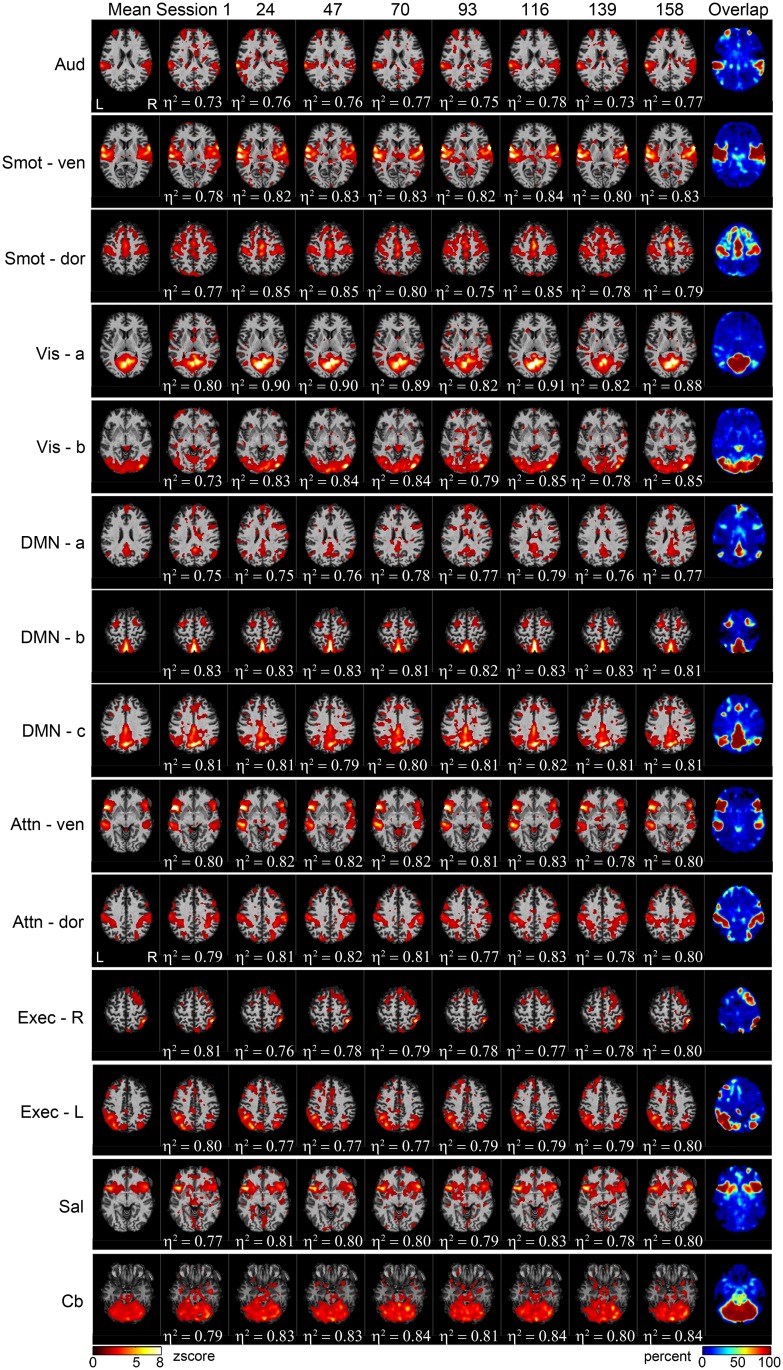
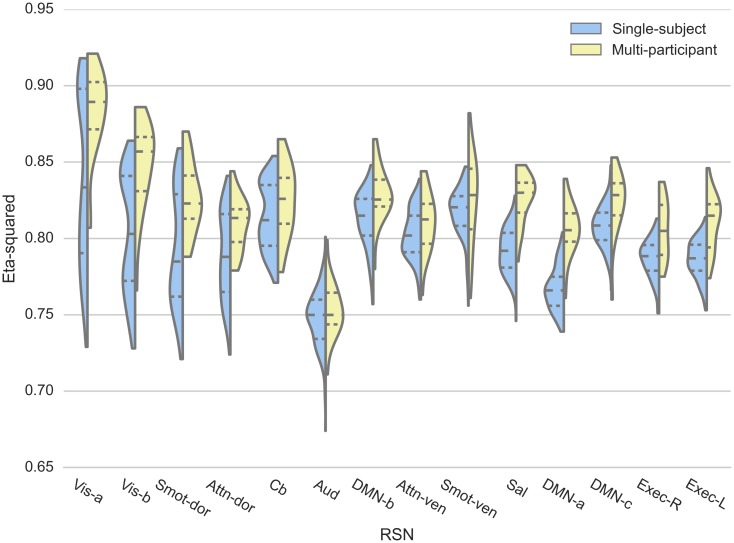
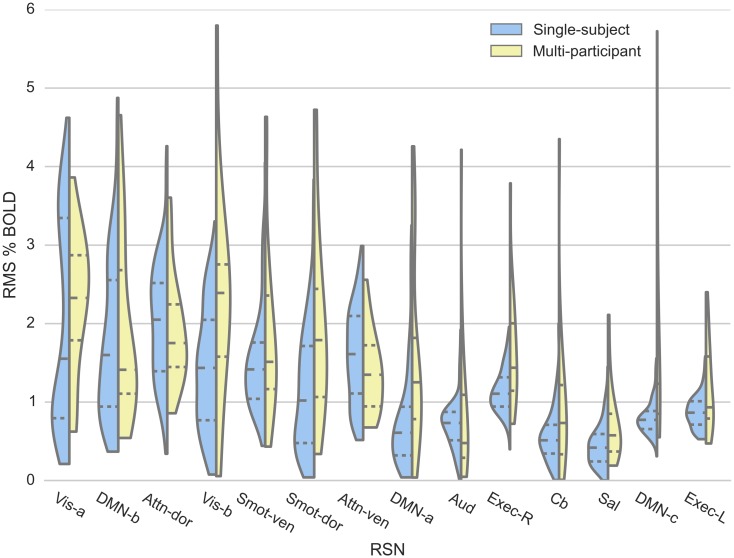
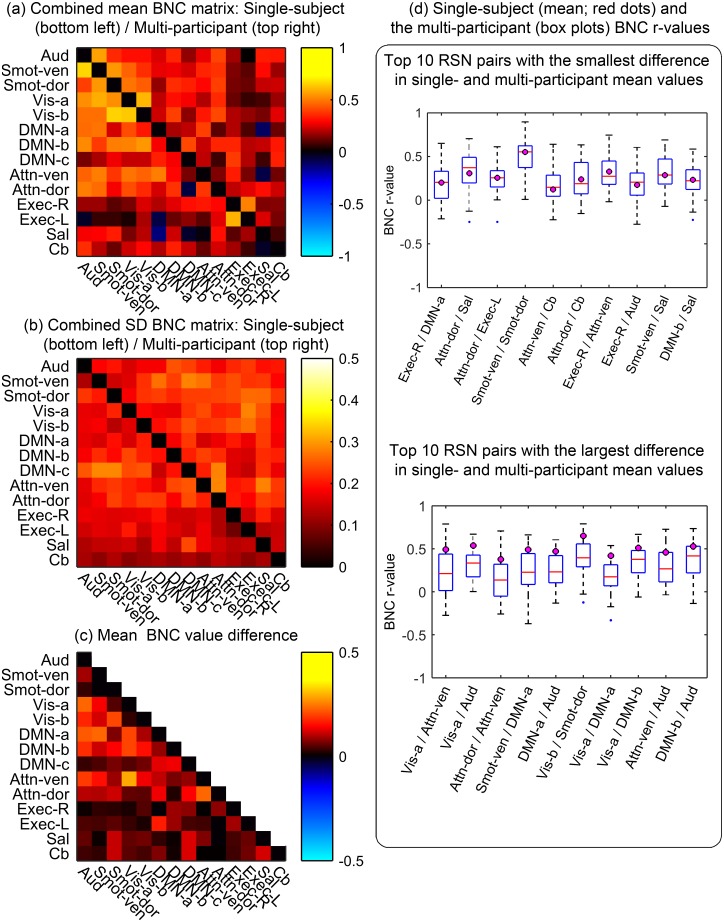
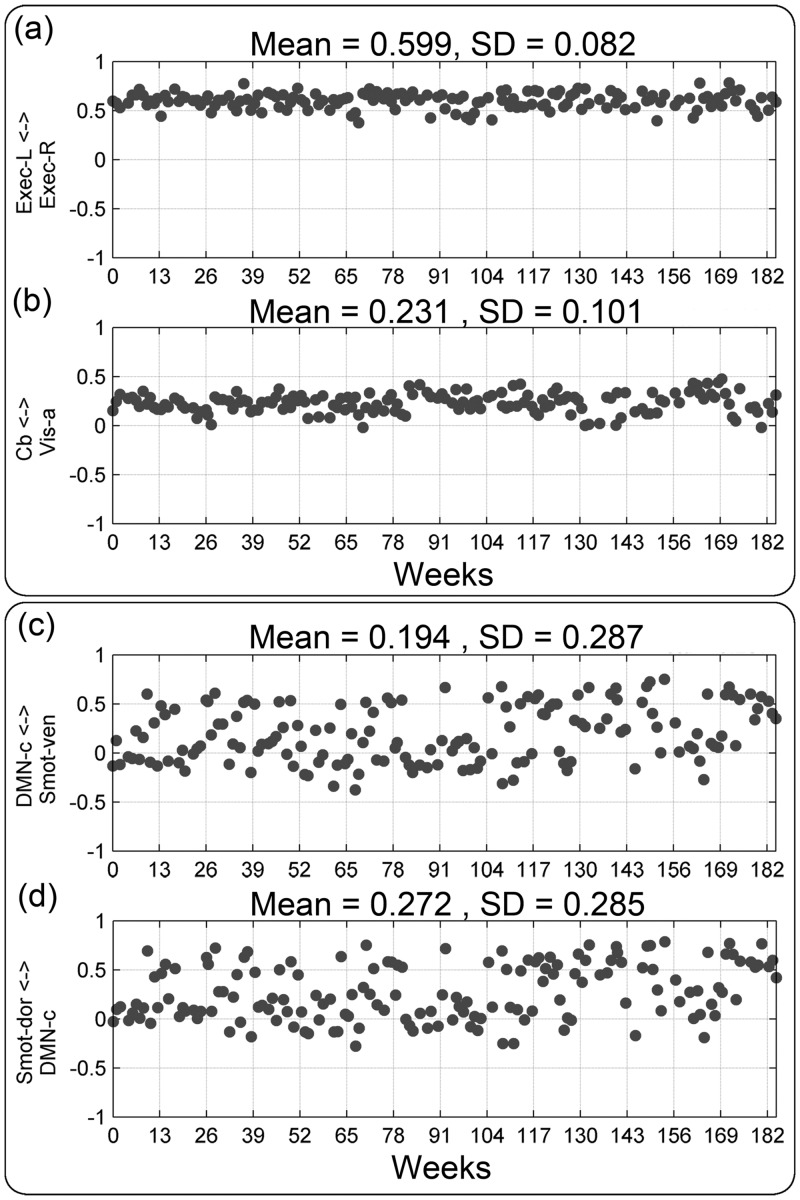
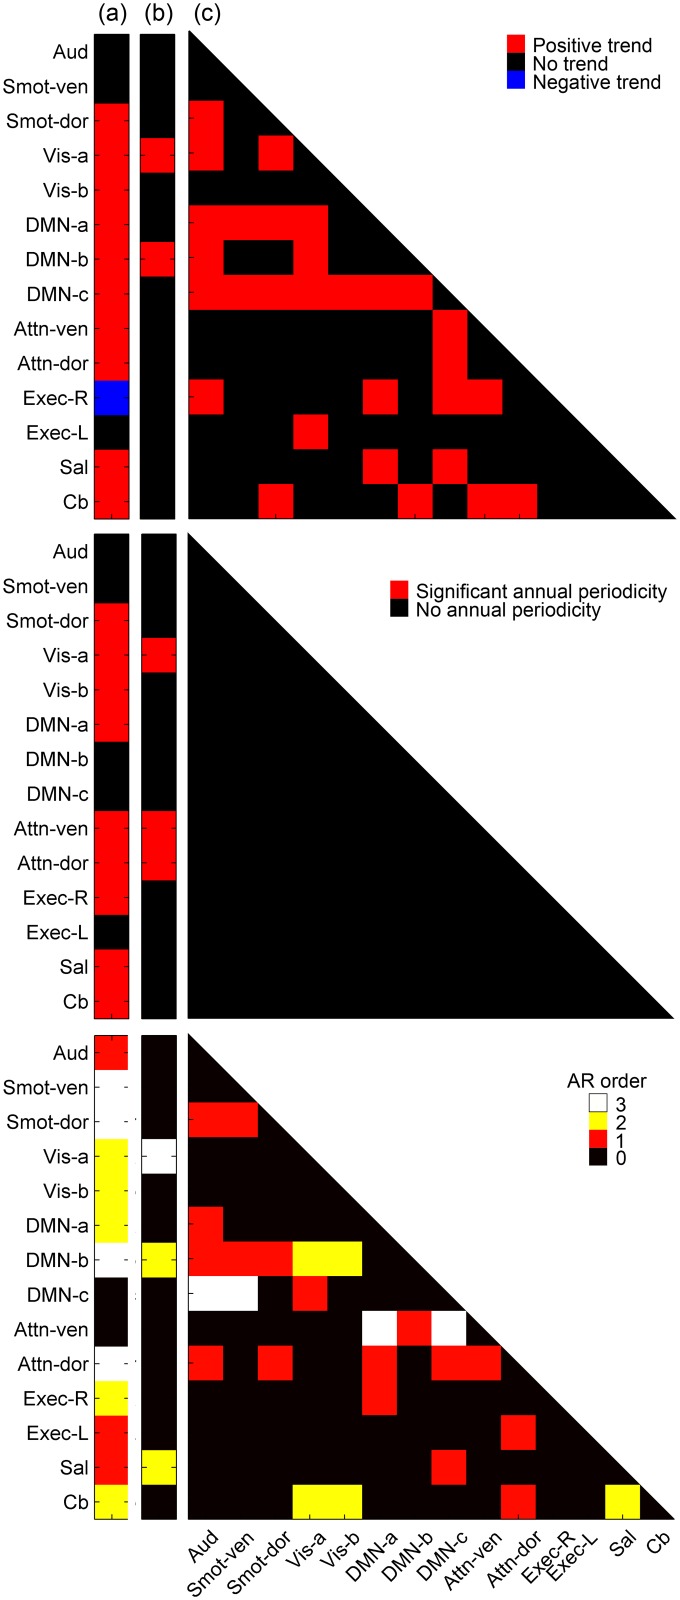
Resting-state functional MRI (rs-fMRI) permits study of the brain's functional networks without requiring participants to perform tasks. Robust changes in such resting state networks (RSNs) have been observed in neurologic disorders, and rs-fMRI outcome measures are candidate biomarkers for monitoring clinical trials, including trials of extended therapeutic interventions for rehabilitation of patients with chronic conditions. In this study, we aim to present a unique longitudinal dataset reporting on a healthy adult subject scanned weekly over 3.5 years and identify rs-fMRI outcome measures appropriate for clinical trials. Accordingly, we assessed the reproducibility, and characterized the temporal structure of, rs-fMRI outcome measures derived using independent component analysis (ICA). Data was compared to a 21-person dataset acquired on the same scanner in order to confirm that the values of the single-subject RSN measures were within the expected range as assessed from the multi-participant dataset. Fourteen RSNs were identified, and the inter-session reproducibility of outcome measures-network spatial map, temporal signal fluctuation magnitude, and between-network connectivity (BNC)-was high, with executive RSNs showing the highest reproducibility. Analysis of the weekly outcome measures also showed that many rs-fMRI outcome measures had a significant linear trend, annual periodicity, and persistence. Such temporal structure was most prominent in spatial map similarity, and least prominent in BNC. High reproducibility supports the candidacy of rs-fMRI outcome measures as biomarkers, but the presence of significant temporal structure needs to be taken into account when such outcome measures are considered as biomarkers for rehabilitation-style therapeutic interventions in chronic conditions.


Conflict of interest statement

Competing Interests: Dr. Pekar serves as Manager of the F.M. Kirby Research Center, which receives research support from Philips Healthcare, which makes the MRI scanner used for this study. Dr. van Zijl is a paid lecturer for Philips and the inventor of technology that is licensed to Philips. This arrangement has been approved by Johns Hopkins University in accordance with its conflict of interest policies. This does not alter the authors' adherence to PLOS ONE policies on sharing data and materials.

Figures

Fig 1
Fig 1. Aggregate spatial maps of the resting state networks (RSNs).
Group independent component analysis (GICA) was used to estimate the RSNs and obtain the aggregate spatial maps. The spatial maps of each RSN are shown as subfigures, with representative sagittal, coronal, and axial views (left-to-right) overlaid on structural images within the Montreal Neurological Institute (MNI) template space; coordinates (in mm) for each view are indicated below each subfigure. (Aud: auditory, Smot: seonsorimotor, Vis: visual, DMN: default mode network, Attn: attention, Exec: executive, Sal: salience, Cb: cerebellar, ven: ventral, dor: dorsal, R: right, L: left).
Fig 2
Fig 2. RSN spatial maps for representative weekly sessions.
RSN mean spatial maps (leftmost column), representative backreconstructed weekly single-session spatial maps (middle eight columns), and overlap maps (rightmost column) for the 14 RSNs. The degree of spatial similarity of each session’s spatial map to the corresponding mean map, as measured using eta-squared (η2), is indicated below the single-session maps.
Fig 3
Fig 3. Reproducibility of RSN spatial maps.
Spatial similarity of each session’s RSN spatial map to the corresponding group mean map, measured using eta-squared (η2), for single-subject (blue) and multi-participant (yellow) datasets, is visualized using violin plots. The first, second, and third quartiles of the data are represented within the violin plots as dotted lines.
Fig 4
Fig 4. Reproducibility of RSN signal temporal fluctuation magnitude.
Blood oxygenation level dependent (BOLD) signal fluctuation magnitude for each session’s RSN time courses, calculated as root-mean-squared (RMS) % BOLD for the single-subject (blue) and multi-participant (yellow) data, is visualized using violin plots.
Fig 5
Fig 5. Reproducibility of between-network connectivity (BNC) measurements.
The combined BNC matrices show the degree of temporal synchrony between RSN pairs. Mean (a) and standard deviation (SD) (b) BNC values of the single- (below the main diagonal) and multi-participant (above the main diagonal) are shown. The diagonal elements were zeroed for display purposes. (c) Absolute value of the difference between the single- and the multi-participant BNC values. (d) Ten RSN pairs with the smallest (top) and the biggest (bottom) differences between single- and multi-participant mean BNC values. Mean BNC values from the single-subject dataset are overlaid as magenta circles on boxplots reporting on multi-participant data.
Fig 6
Fig 6. Weekly BNC measures of RSN pairs with the two largest and smallest variations in BNC measurements.
Weekly BNC measures are plotted against the corresponding image acquisition weeks for the RSN pairs with the two largest (top) and two smallest (bottom) variations in BNC measurements, as measured by SD.
Fig 7
Fig 7. RSNs with significant temporal structures.
TOP Existence of significant (after correction for multiple comparisons) linear trends in three RSN outcome measures, namely the (a) spatial similarity (eta-squared, η2), (b) temporal signal fluctuation magnitude, and (c) BNC, are visualized using matrices. Red blocks indicate significant positive linear trend, blue blocks negative trend, and black boxes no significant trend. MIDDLE Existence of significant (after correction for multiple comparisons) annual periodicity in three RSN outcome measures. Red blocks indicate significant annual periodicity and black boxes no annual periodicity. BOTTOM AR orders of the estimated ARMA models for RSNs and RSN pairs are visualized for each outcome measures, where black box indicates no autocorrelation, red box AR order of 1, yellow box AR order of 2, and white box AR order of 3. Refer to S3 Table for information on full ARMA model parameters.

References

    1. Biswal B, Yetkin FZ, Haughton VM, Hyde JS. Functional connectivity in the motor cortex of resting human brain using echo-planar MRI. Magn Reson Med. 1995;34: 537–541. - PubMed
    1. Belegu V, Oudega M, Gary DS, McDonald JW. Restoring function after spinal cord injury: Promoting spontaneous regeneration with stem cells and activity-based therapies. Neurosurg Clin N Am. 2007;18: 143–68, xi - PubMed
    1. Lorenz DJ, Datta S, Harkema SJ. Longitudinal patterns of functional recovery in patients with incomplete spinal cord injury receiving activity-based rehabilitation. Arch Phys Med Rehabil. 2012;93: 1541–1552. 10.1016/j.apmr.2012.01.027 - DOI - PubMed
    1. Damiano DL. Activity, activity, activity: Rethinking our physical therapy approach to cerebral palsy. Phys Ther. 2006;86: 1534–1540. - PubMed
    1. Martin JH, Chakrabarty S, Friel KM. Harnessing activity-dependent plasticity to repair the damaged corticospinal tract in an animal model of cerebral palsy. Dev Med Child Neurol. 2011;53 Suppl 4: 9–13. 10.1111/j.1469-8749.2011.04055.x - DOI - PMC - PubMed

Publication types