. 2015 Dec 25;290(52):30813-29.
doi: 10.1074/jbc.M115.681619. Epub 2015 Oct 30.

Telomerase Deficiency Causes Alveolar Stem Cell Senescence-associated Low-grade Inflammation in Lungs

Affiliations

Telomerase Deficiency Causes Alveolar Stem Cell Senescence-associated Low-grade Inflammation in Lungs

Ruping Chen et al. J Biol Chem. .

Abstract

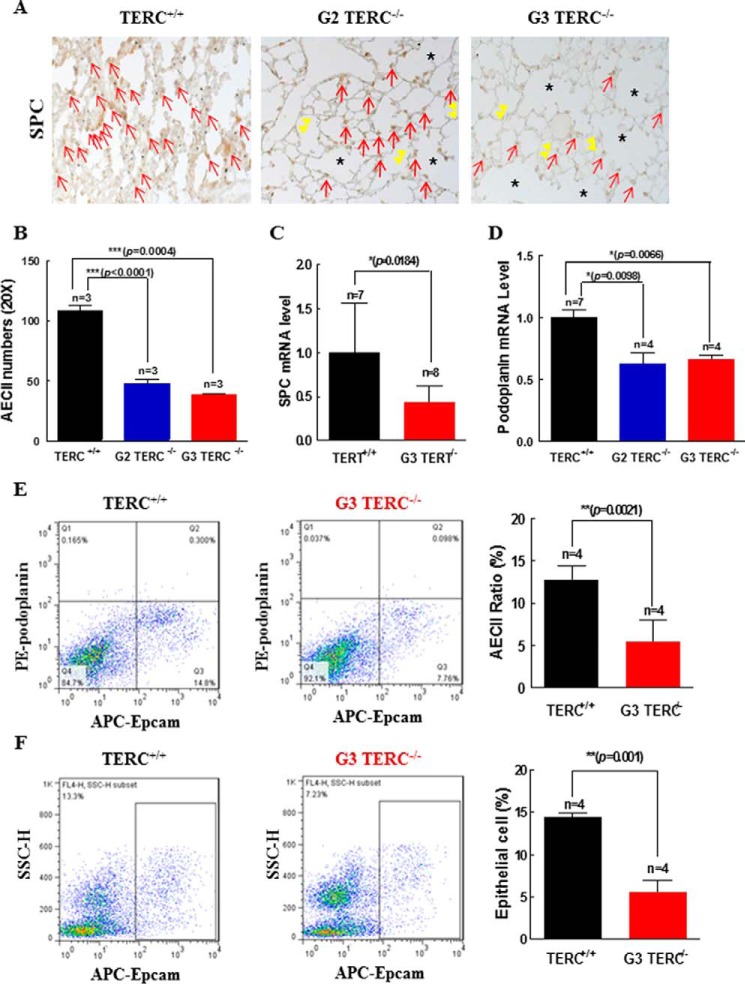
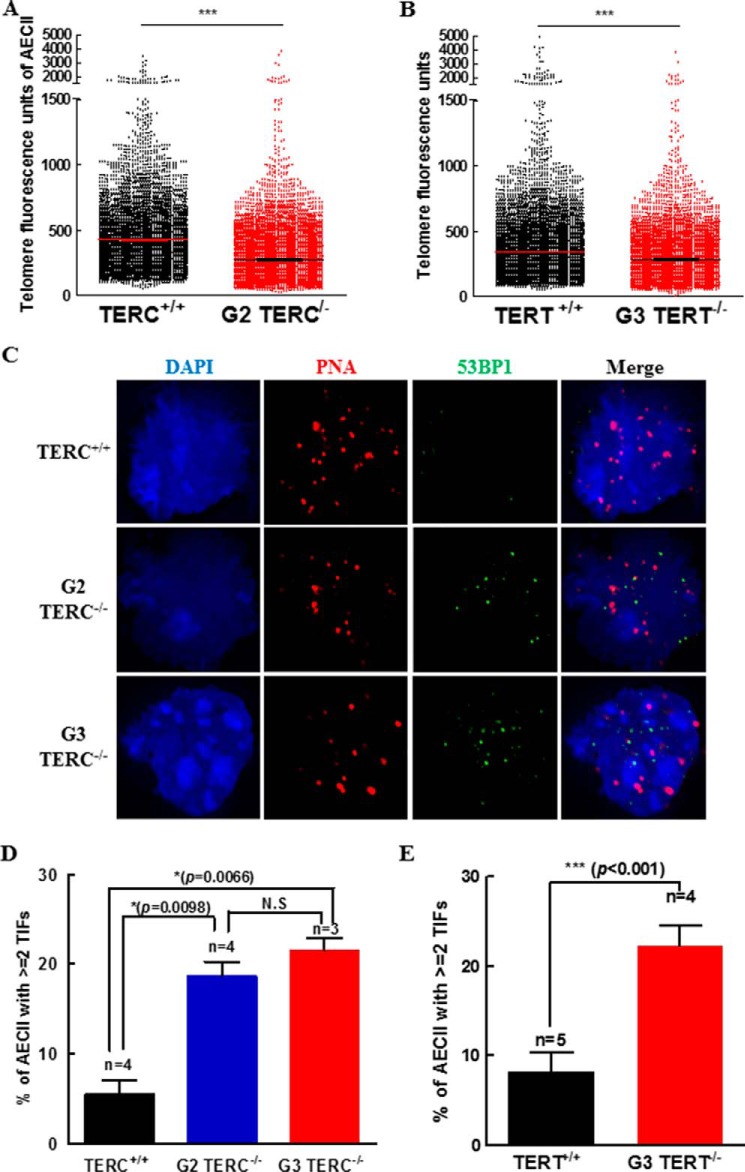
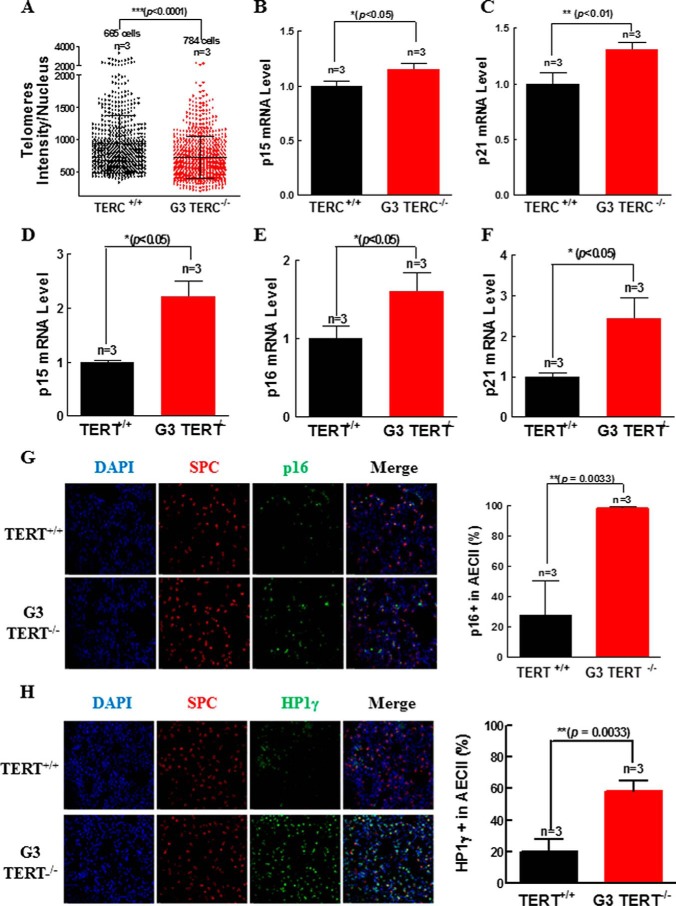
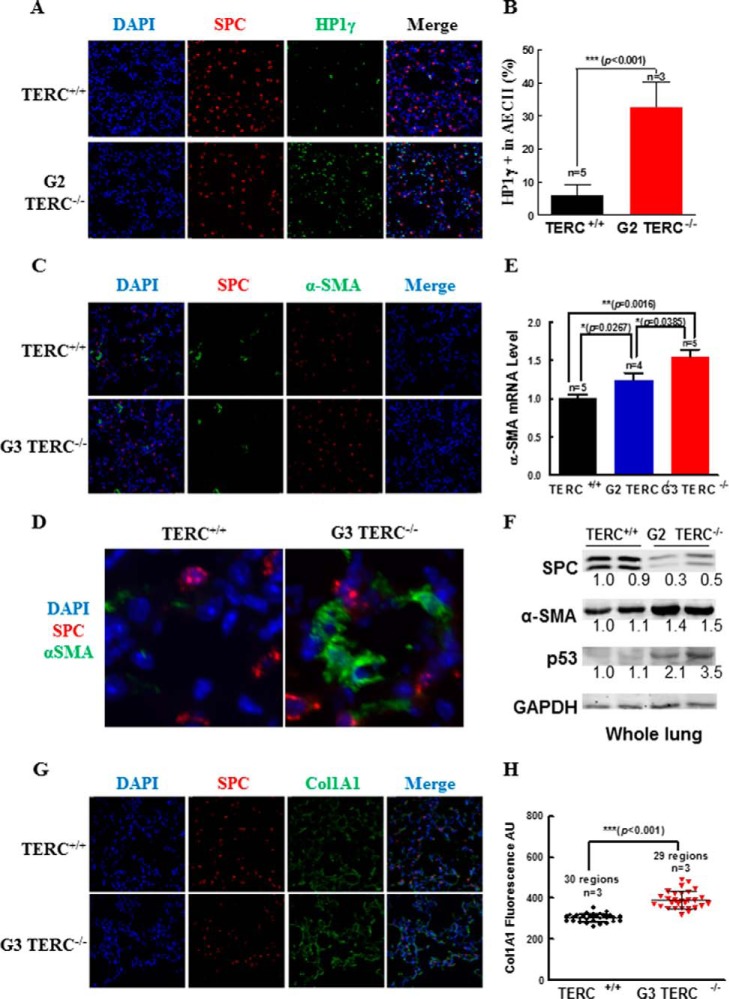
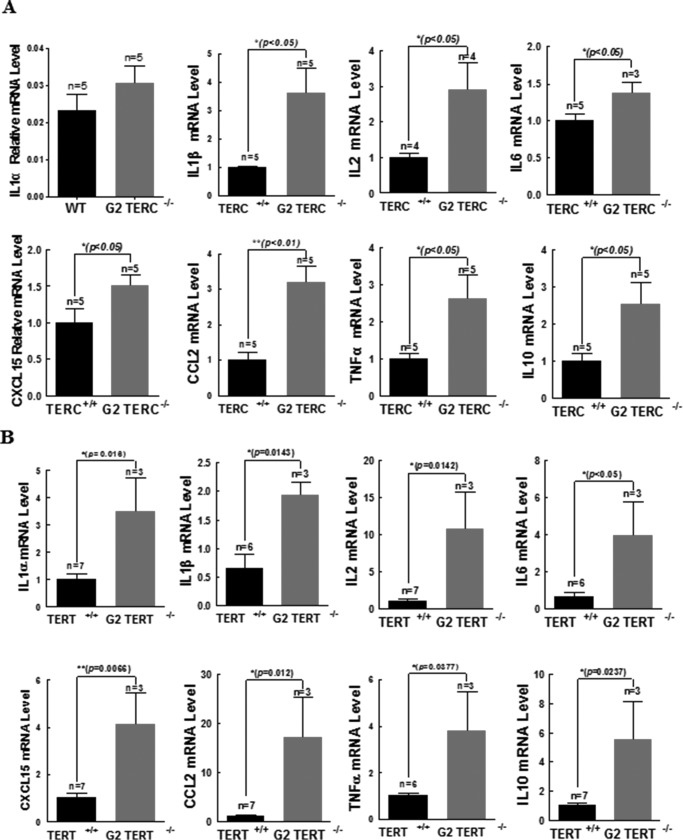
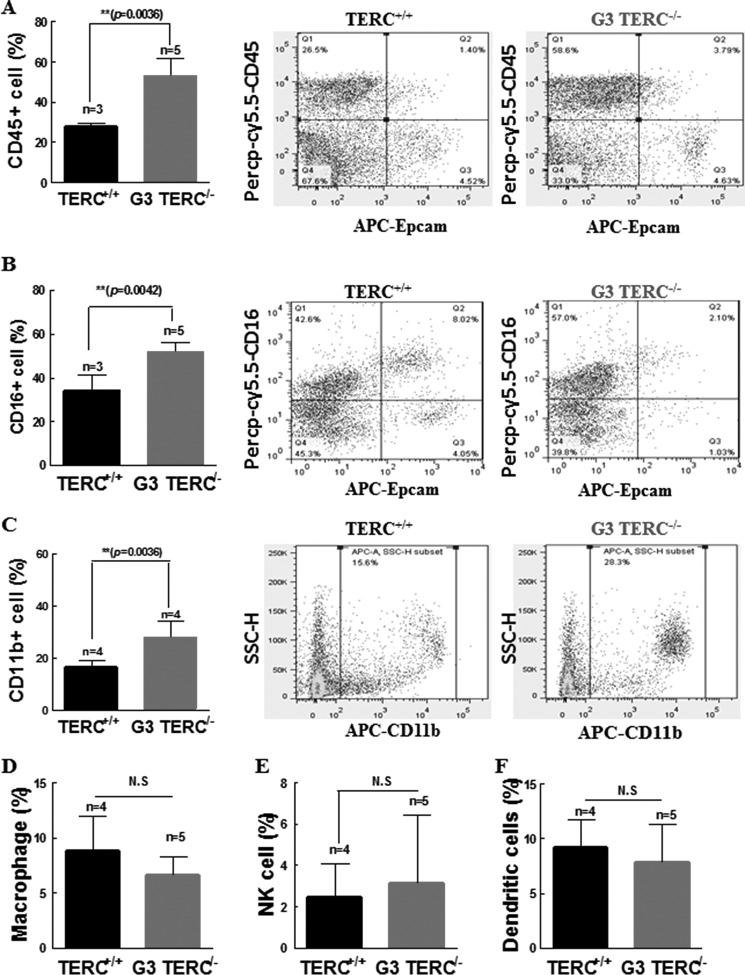
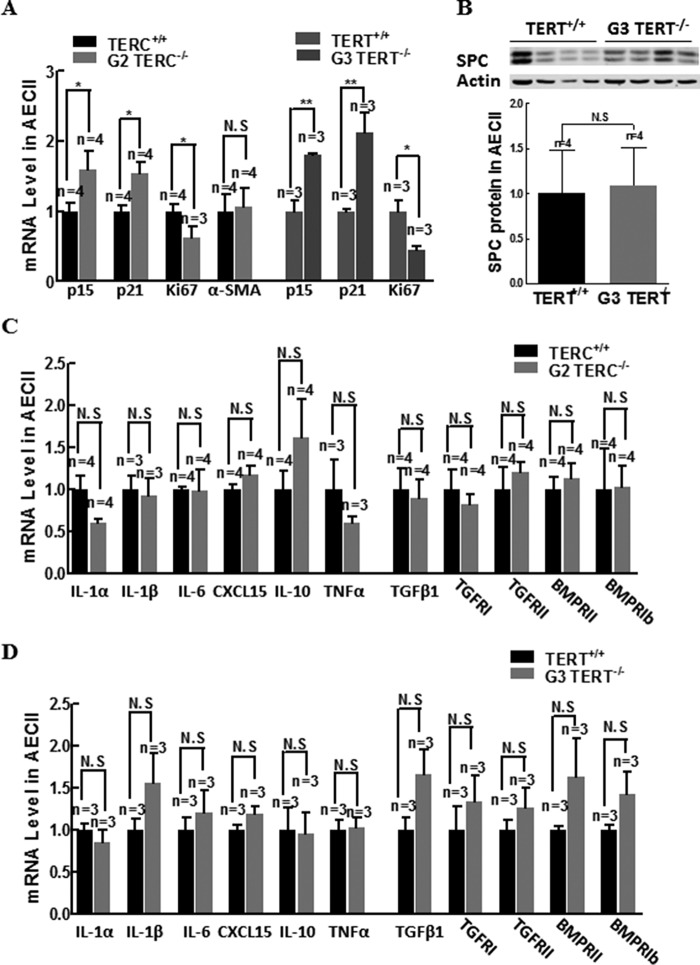
Mutations of human telomerase RNA component (TERC) and telomerase reverse transcriptase (TERT) are associated with a subset of lung aging diseases, but the mechanisms by which TERC and TERT participate in lung diseases remain unclear. In this report, we show that knock-out (KO) of the mouse gene Terc or Tert causes pulmonary alveolar stem cell replicative senescence, epithelial impairment, formation of alveolar sacs, and characteristic inflammatory phenotype. Deficiency in TERC or TERT causes a remarkable elevation in various proinflammatory cytokines, including IL-1, IL-6, CXCL15 (human IL-8 homolog), IL-10, TNF-α, and monocyte chemotactic protein 1 (chemokine ligand 2 (CCL2)); decrease in TGF-β1 and TGFβRI receptor in the lungs; and spillover of IL-6 and CXCL15 into the bronchoalveolar lavage fluids. In addition to increased gene expressions of α-smooth muscle actin and collagen 1α1, suggesting myofibroblast differentiation, TERC deficiency also leads to marked cellular infiltrations of a mononuclear cell population positive for the leukocyte common antigen CD45, low-affinity Fc receptor CD16/CD32, and pattern recognition receptor CD11b in the lungs. Our data demonstrate for the first time that telomerase deficiency triggers alveolar stem cell replicative senescence-associated low-grade inflammation, thereby driving pulmonary premature aging, alveolar sac formation, and fibrotic lesion.

Keywords: alveolar senescence; chronic obstructive pulmonary disease (COPD); lung aging; proinflammatory cytokines; pulmonary fibrosis; telomerase; telomerase reverse transcriptase (TERT); telomere; telomeres.


Figures

FIGURE 1.
FIGURE 1.
Pulmonary aging induced by TERC or TERT deficiency. A, β-gal staining of pulmonary sections from TERC-null mice. The left and middle panels are representative micrographs of β-gal staining observed with a ×20 and ×40 objective lens. Blue arrows, positive stained cells; asterisks, alveolar sacs. The right bar graph shows the quantitative data of the β-gal staining from three animals. Data are the mean ± S.E. (error bars). B, β-gal staining of the pulmonary sections from TERT-null mice. The left and middle panels are representative micrographs of β-gal staining observed with a ×20 objective lens. Blue arrows, positive stained cells; asterisks, alveolar sacs. The right bar graph shows the quantitative data of the β-gal staining from three animals. Data are the mean ± S.E. C–E, comparisons of alveolar counts (C), alveolar sac counts (D), and total alveolar areas (E) between WT and G3 TERC-null lungs. Data are mean ± S.E. from three experiments. F–H, SA-β-gal activity in AECII was detected by flow cytometry with incubation of C12FDG and AECII markers. RU, relative units.
FIGURE 2.
FIGURE 2.
TERC or TERT deficiency induced alveolar epithelial cell replicative senescence. A, SPC-positive staining of AECII in TERC-null mice by immunohistochemistry. Red arrows, SPC-positive staining; double yellow arrowheads, thin alveolar walls; asterisks, alveolar sacs. B, quantitation of AECII on the pulmonary sections from WT, G2, and G3 TERC-null mice. Data are the mean ± S.D. (error bars) from three animals. C, SPC mRNA expression in AECII from TERT-null mice. Data are the mean ± S.E. (error bars) (n = 8). D, podoplanin mRNA expression in alveolar epithelial type I cells from TERC-null mice. Data are the mean ± S.E. (n = 4). E, AECII in the lung of G3 TERC-null mice by flow cytometry labeled with APC-EpCAM and PE-podoplanin. The left and middle panels are representative of AECII sorting, and the right bar graph shows the pooled data (mean ± S.E.) from four animals. F, total alveolar epithelial cells in the lung of G3 TERC-null mice were labeled with APC-EpCAM and analyzed by flow cytometry. The left and middle panels are representative of cell sorting, and the right bar graph shows the pooled data (mean ± S.E.) from four animals.
FIGURE 3.
FIGURE 3.
Telomerase deficiency induced telomere shortening and TIFs in isolated AECII population. A and B, distributions of telomere length in AECII determined by quantitative FISH and expressed as mean telomere fluorescence of each isolated AECII. C, micrographs of peptide nucleic acid probe-labeled telomeres, 53BP1 antibody-labeled damaged DNA, and co-localized telomere and 53BP1 foci. D and E, mean counts for isolated AECII with each cell containing more than two TIFs. Error bars, S.E.
FIGURE 4.
FIGURE 4.
Shortening of telomeres and increases in p15, p16, and p21 genes in telomerase-deficient lungs. A, quantitative FISH experiment result for isolated AECII from G3 TERC-null mice. The telomere length is represented by fluorescence intensity in scatter plot style. B and C, the mRNA levels of p15 (B) and p21 (C) were determined by quantitative real-time PCR from three WT or G3 TERC-null animals as indicated. D–F, the mRNA levels of p15 (D), p16 (E), and p21 (F) were determined by quantitative real-time PCR from three WT or G3 TERT-null animals as indicated. G, P16 and SPC expression by immunostaining on pulmonary sections from G3 TERT-null mice. The left panels are representative micrographs, and the right bar graph shows the quantitative data (mean ± S.D. (error bars)) of three experiments. H, HP1γ and SPC staining on pulmonary sections from G3 TERT-null mice using specific antibodies. The left panels are representative micrographs, and the right bar graph shows the quantitative data (mean ± S.D.) of three experiments.
FIGURE 5.
FIGURE 5.
TERC deficiency induced increases of α-SMA and Col1A1 gene expressions in pulmonary AECII. A and B, HP1γ and SPC staining in the pulmonary sections from G2 TERC-null mice, with representative micrographs (A) and the quantitative data (B) (mean ± S.D.) of 3–5 animals. C and D, α-SMA expression in lung tissue of TERC-null mice detected by immunofluorescence staining using specific antibodies. Enlarged images of WT and TERC-null are shown in D. E, the α-SMA mRNA levels were measured by quantitative real-time PCR from TERC-null mice lungs. Data are the mean ± S.E. (error bars) from at least five animals. F, Western blotting assessment of SPC, α-SMA, and p53 immunoreactivities in the lung tissues of duplicate WT and G2 TERC-null mice. G and H, Col1A1 expression in the lung tissues of TERC-null mice was measured by immunofluorescence staining using specific antibodies. Relative quantification of Col1A1 immunoreactivity was analyzed by Softworx software (D). Data are the mean ± S.D. (error bars) from three representative experiments. Representative images are shown in E.
FIGURE 6.
FIGURE 6.
TERC or TERT deficiency resulted in reduced gene expression of TGF-β1 and canonical receptors in pulmonary tissues. A–C, the mRNA levels of TGF-β1 (A), TGFβRII (B), and TGFβRI (C) were determined by quantitative real-time PCR from at least four animals, as indicated. D–F, the mRNA levels of BMPRII (D), BMPRIa (E), and BMPRIb (F) were determined by quantitative real-time PCR from at least four animals, as indicated. G, TGFβ1 levels detected by ELISA using specific antibodies from BAL fluid of TERC-null mice. H and I, IL-6 and CXCL15 levels measured by ELISA from BAL fluid of TERC-null mice. J and K, IL-6 and CXCL15 levels measured by ELISA from BAL fluid of TERT-null mice. All data are the mean ± S.E. (error bars) of multiple representative experiments.
FIGURE 7.
FIGURE 7.
TERC or TERT deficiency induced significant disorders of cytokines and growth factors in the pulmonary tissues. A, IL-1α, IL-1β, IL-2, IL-6, CXCL15, CCL2, TNF-α, and IL-10 mRNA levels were detected in TERC-null mice lungs by quantitative PCR. B, IL-1α, IL-1β, IL-2, IL-6, CXCL15, CCL2, TNF-α, and IL-10 mRNA levels were detected in TERT-null mice lungs by quantitative PCR. All data are the mean ± S.E. (error bars) of multiple similar experiments. Statistical p values are as indicated.
FIGURE 8.
FIGURE 8.
TERC deficiency resulted in inflammatory cell infiltration in pulmonary tissues. A, TERC deficiency induced increases in CD45-positive mononuclear cells. The left bar graph shows summarized data presented as the mean ± S.D. (error bars) from three flow cytometric analyses. The middle and right panels are representative plots of cell distributions labeled by Percp-cy5.5-CD45 but not by EpCAM. B, TERC deficiency induced increases in CD16/32-positive mononuclear cells. The left bar graph shows summarized data presented as mean ± S.D. from at least three animals. The middle and right panels are representative plots of cell distributions labeled by APC-CD11b. C, TERC deficiency induced increases in CD11b-positive mononuclear cells. The left bar graph shows summarized data presented as mean ± S.D. from at least three animals. The middle and right panels are representative plots of cell distributions labeled by FITC-F1/80, PE-NK1.1, and APC-CD11c (D–F). TERC deficiency resulted in no changes in the ratios of macrophages (D), NK cells (E), or dendritic cells (F) by flow cytometry.
FIGURE 9.
FIGURE 9.
Characterization of AECII gene expression of proliferation markers, proinflammatory cytokines, TGF-β1, and receptors. A, transcriptional levels of proliferation marker, p15, p21, and Ki67 mRNAs in isolated AECII from telomerase wild type and deficient mouse lungs by quantitative PCR. B, SPC protein expression in isolated AECII measured by Western blotting and analyzed with semiquantification. C, transcriptional levels of IL and TGF-β family mRNAs in isolated AECII from G2 TERC-null mice lungs. D, transcriptional levels of IL and TGF-β family mRNAs in isolated AECII from G3 TERT-null mice lungs. Error bars, S.E.; N.S, not significant.

References

    1. Blackburn E. H. (2005) Telomeres and telomerase: their mechanisms of action and the effects of altering their functions. FEBS Lett. 579, 859–862 - PubMed
    1. Nandakumar J., and Cech T. R. (2013) Finding the end: recruitment of telomerase to telomeres. Nat. Rev. Mol. Cell Biol. 14, 69–82 - PMC - PubMed
    1. Armanios M. (2013) Telomeres and age-related disease: how telomere biology informs clinical paradigms. J. Clin. Invest. 123, 996–1002 - PMC - PubMed
    1. Kong C. M., Lee X. W., and Wang X. (2013) Telomere shortening in human diseases. FEBS J. 280, 3180–3193 - PubMed
    1. Mitchell J. R., Wood E., and Collins K. (1999) A telomerase component is defective in the human disease dyskeratosis congenita. Nature 402, 551–555 - PubMed

Publication types

MeSH terms