. 2015 Dec 2;43(21):10338-52.
doi: 10.1093/nar/gkv1139. Epub 2015 Oct 30.

Zebrafish lacking functional DNA polymerase gamma survive to juvenile stage, despite rapid and sustained mitochondrial DNA depletion, altered energetics and growth

Affiliations

Zebrafish lacking functional DNA polymerase gamma survive to juvenile stage, despite rapid and sustained mitochondrial DNA depletion, altered energetics and growth

Jennifer J Rahn et al. Nucleic Acids Res. .

Abstract

DNA polymerase gamma (POLG) is essential for replication and repair of mitochondrial DNA (mtDNA). Mutations in POLG cause mtDNA instability and a diverse range of poorly understood human diseases. Here, we created a unique Polg animal model, by modifying polg within the critical and highly conserved polymerase domain in zebrafish. polg(+/-) offspring were indistinguishable from WT siblings in multiple phenotypic and biochemical measures. However, polg(-/-) mutants developed severe mtDNA depletion by one week post-fertilization (wpf), developed slowly and had regenerative defects, yet surprisingly survived up to 4 wpf. An in vivo mtDNA polymerase activity assay utilizing ethidium bromide (EtBr) to deplete mtDNA, showed that polg(+/-) and WT zebrafish fully recover mtDNA content two weeks post-EtBr removal. EtBr further reduced already low levels of mtDNA in polg(-/-) animals, but mtDNA content did not recover following release from EtBr. Despite significantly decreased respiration that corresponded with tissue-specific levels of mtDNA, polg(-/-) animals had WT levels of ATP and no increase in lactate. This zebrafish model of mitochondrial disease now provides unique opportunities for studying mtDNA instability from multiple angles, as polg(-/-) mutants can survive to juvenile stage, rather than lose viability in embryogenesis as seen in Polg mutant mice.


Figures

Figure 1.
Figure 1.
TALEN-induced mutations in Danio rerio polg. (A) Sequence alignment of TALEN region. TALEN binding sites are shown (boxes). Three different mutations were identified. Alleles were named muz119, muz120, muz121. (B) Protein alignment of human, WT Danio, and three identified mutant alleles of the polymerase domain of Polg. Two mutant alleles (muz119 and muz120) yield proteins with similar miscoding and a premature stop. The muz121 allele results in a four amino acid deletion spanning hY955 (boxed).
Figure 2.
Figure 2.
polg−/− zebrafish exhibit decreased survival by 3 wpf. Proportions of each genotype are shown for each age range of zebrafish. Pearson's Chi-square values are shown above each bar indicating whether the observed ratios were significantly different from the expected ratios. N = 196 for 3 dpf, 486 for 1 wpf, 433 for 1.5–2 wpf, and 875 for 2.5–3 wpf.
Figure 3.
Figure 3.
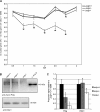
polg−/− zebrafish exhibit severe and sustained mtDNA depletion, have less full-length Polg and Vdac1 protein while heterozygous zebrafish have similar levels as WT. (A) DNA was isolated from whole individuals at various time points. Mean dCt values were calculated as Ct of nd1 (mitochondrially-encoded gene) minus Ct of ef1a (nuclear gene) and plotted with SEM (see Supplemental Table S1 for dCt values, sample sizes for each time point and P-values). * indicates P ≤ 0.05 difference from WT by Mann–Whitney nonparametric test. (B) Representative western blot analysis of Polg and Vdac1 mitochondrial protein from 3 wpf zebrafish larvae. Recombinant human POLG was run on the same gel, as a positive control for the mtDNA polymerase. (C) Densitometry of multiple blots. n = 3–4.
Figure 4.
Figure 4.
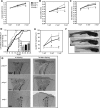
Growth, development, and caudal fin regrowth are altered in polg−/− but not polg+/− zebrafish. Means ± SEM of body length (A), body width (B), and eye diameter (C) measured at 1–3 wpf for each genotype. (D) The cumulative probability of the angle of notochord flexion at 3 wpf for each genotype with means ± SEM given in the inset. (E) Means ± SEM of caudal fin regrowth 3 days after amputation for each age group. (F) Images of each zebrafish genotyped at 3 wpf. Scale bar = 1 mm. (G) Images of caudal fins from 3 wpf zebrafish immediately after (left column) and 3 days after amputation (right column). Amount of regrowth is shaded. Scale bar = 100 μm. * indicates significant difference from WT; P ≤ 0.05 by ANOVA/Steel post hoc test. See Supplemental Table S2 for values, sample sizes and P-values.
Figure 5.
Figure 5.
ATP and lactate are not altered in polg−/− zebrafish. (A) Mean whole body ATP content normalized to protein concentration is plotted with SEM for zebrafish at 1 and 3 wpf. (B) Whole body lactate normalized to protein concentration is plotted with SEM for zebrafish at 1 and 3 wpf. Mean values are displayed on respective bars. * indicates significant difference from WT; P ≤ 0.05 by t-test.
Figure 6.
Figure 6.
polg+/+ and polg+/− zebrafish recover from EtBr-induced mtDNA depletion while polg−/− zebrafish remain depleted of mtDNA. Zebrafish embryos were treated with EtBr starting at 3 hpf for 6 days before EtBr was removed. Mean dCt values at 1, 2 and 3 wpf are shown with SEM (see Supplemental Table S3 for fold change values, sample sizes and P-values). (a) Indicates significant difference between untreated WT and EtBr-treated WT; (b) indicates significant difference between untreated WT and untreated polg+/−; (c) indicates significant difference between untreated WT and untreated polg−/−; (d) indicates significant difference between untreated polg−/− and EtBr-treated polg−/−; (e) indicates significant difference between untreated polg+/− and EtBr-treated polg+/− animals. Significance achieved when P ≤ 0.05 by Mann–Whitney test.
Figure 7.
Figure 7.
MtDNA content differs between tissues in polg−/− zebrafish, correlating with tissue specific levels of respiration. (A) Zebrafish tissue groups were isolated and analyzed for mtDNA content over time. Shown are mean dCt values with SEM *indicates significant difference from WT of the same tissue group; P ≤ 0.05 by Mann–Whitney test (see Supplemental Table S4 for fold change values, sample sizes and P-values). (B) Basal respiration (black) and maximal FCCP-uncoupled respiration (white) were measured from CNS tissue of 3 wpf zebrafish. *indicates significant difference from WT; P ≤ 0.05 ANOVA/Steel posthoc test (see Supplemental Table S5 for means, sample sizes and P-values). (C) There is a significant correlation between mtDNA content and respiration levels of CNS tissue. polg−/− samples (diamonds) cluster together with low mtDNA and respiration while polg+/− samples (crosses) display WT levels (circles) of mtDNA and respiration.

References

    1. Copeland W.C. Defects of mitochondrial DNA replication. J. Child Neurol. 2014;29:1216–1224. - PMC - PubMed
    1. Zheng W., Khrapko K., Coller H.A., Thilly W.G., Copeland W.C. Origins of human mitochondrial point mutations as DNA polymerase gamma-mediated errors. Mutat. Res. 2006;599:11–20. - PubMed
    1. Chinnery P.F., Hudson G. Mitochondrial genetics. Br. Med. Bull. 2013;106:135–159. - PMC - PubMed
    1. Cohen B.H., Chinnery P.F., Copeland W.C. In: GeneReviews(R) Pagon R.A., Adam M.P., Ardinger H.H., Wallace S.E., Amemiya A., Bean L.J.H., Bird T.D., Dolan C.R., Fong C.T., Smith R.J.H., editors. Seattle, Seattle (WA): Univeristy of Washington; 2010. (eds.)
    1. Koenig M.K. Presentation and diagnosis of mitochondrial disorders in children. Pediatr. Neurol. 2008;38:305–313. - PMC - PubMed

Publication types

MeSH terms

LinkOut - more resources