Review
. 2016 Feb;65(1):69-79.
doi: 10.1093/jmicro/dfv344. Epub 2015 Oct 31.

Two promising future developments of cryo-EM: capturing short-lived states and mapping a continuum of states of a macromolecule

Affiliations
Review

Two promising future developments of cryo-EM: capturing short-lived states and mapping a continuum of states of a macromolecule

Bo Chen et al. Microscopy (Oxf). 2016 Feb.

Abstract

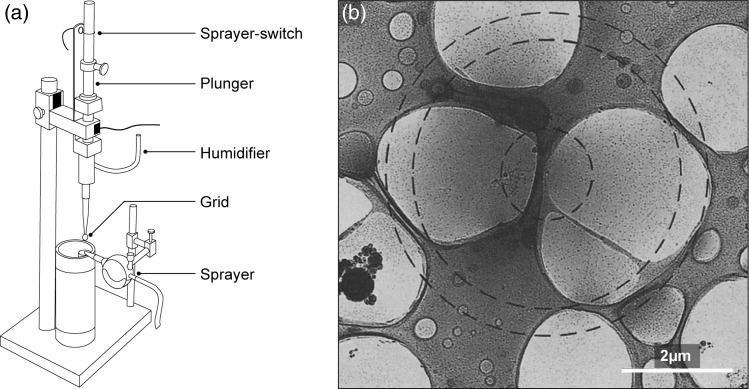
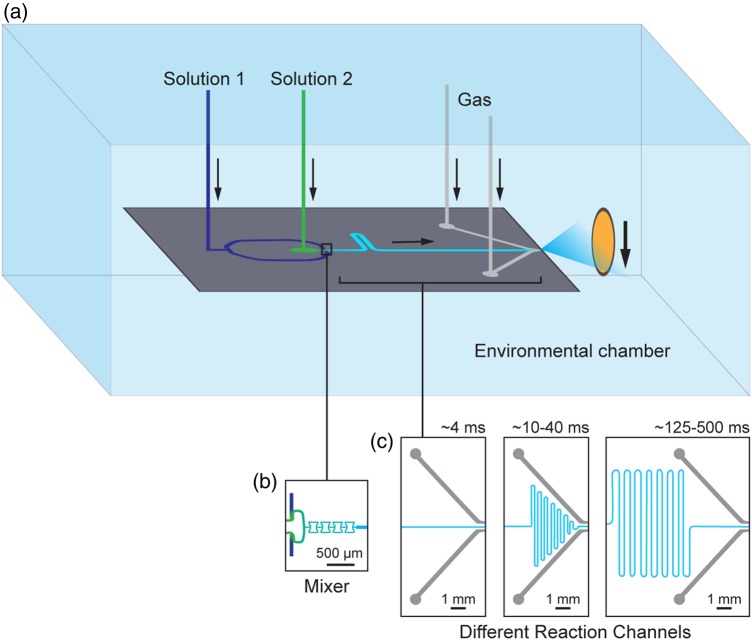
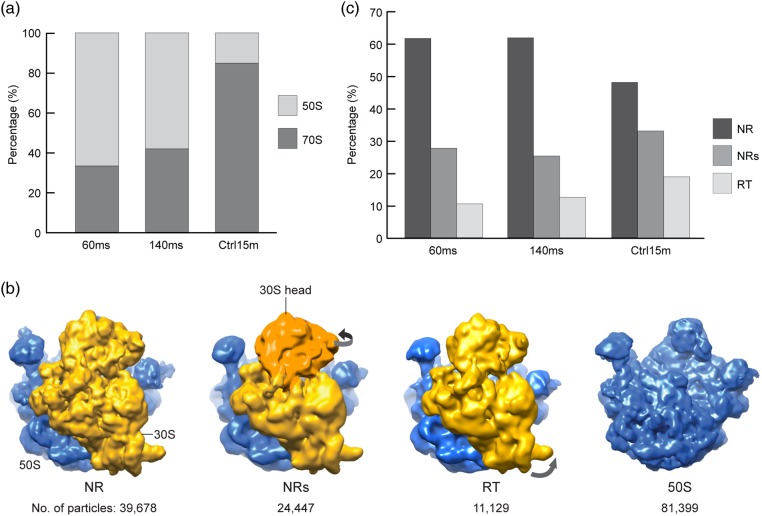
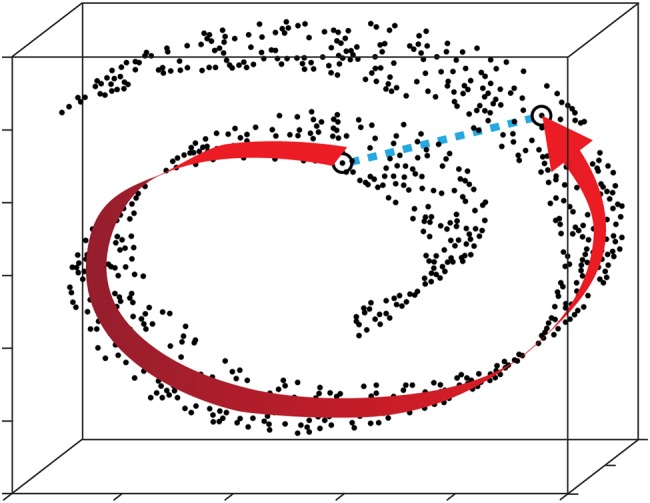
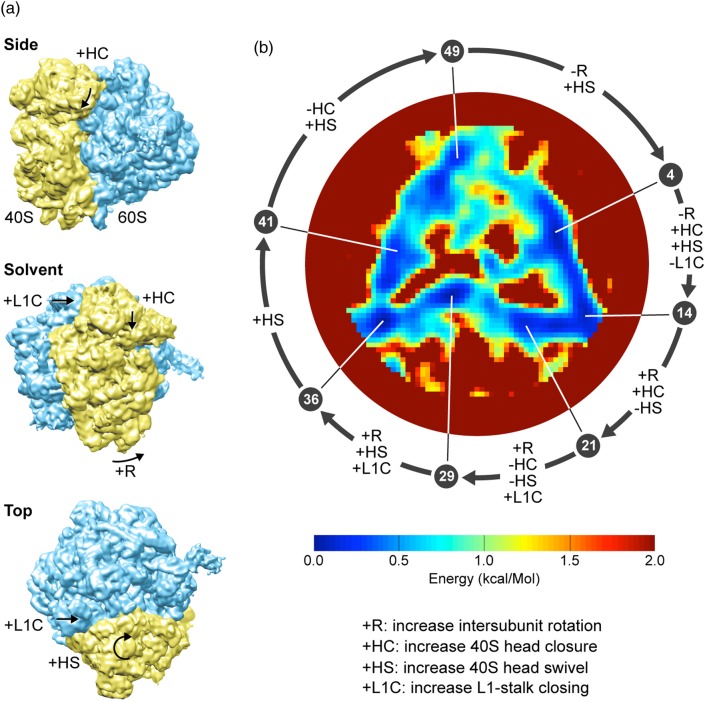
The capabilities and application range of cryogenic electron microscopy (cryo-EM) method have expanded vastly in the last two years, thanks to the advances provided by direct detection devices and computational classification tools. We take this review as an opportunity to sketch out promising developments of cryo-EM in two important directions: (i) imaging of short-lived states (10-1000 ms) of biological molecules by using time-resolved cryo-EM, particularly the mixing-spraying method and (ii) recovering an entire continuum of coexisting states from the same sample by employing a computational technique called manifold embedding. It is tempting to think of combining these two methods, to elucidate the way the states of a molecular machine such as the ribosome branch and unfold. This idea awaits further developments of both methods, particularly by increasing the data yield of the time-resolved cryo-EM method and by developing the manifold embedding technique into a user-friendly workbench.

Keywords: classification; manifold embedding; microfluidics; ribosome; time-resolved imaging; translation.


Figures

Fig. 1.
Fig. 1.
Schematic of the spray-freezing apparatus and an image of a partially spread droplet. (a) The spray-freezing apparatus consists of a guillotine-type plunger and a pneumatic sprayer. A fiber optic sprayer-switch detects the movement of the plunger, and opens a valve for compressed nitrogen gas to set off the spray. The humidifier tube delivers 100% humid air to maintain high humidity around the grid. (b) An image of a partially spread droplet containing ferritin and tobacco mosaic virus on the surface of a thin aqueous film containing turnip yellow virus. The small circle indicates the diameter of the droplet as it would have been before hitting the surface. The intermediate and largest circles indicate the extent of the tobacco mosaic virus and the ferritin particles, respectively. Mixing happens laterally through the aqueous film. Figure adapted from [24].
Fig. 2.
Fig. 2.
Experimental setup of the mixing-spraying method and the design of the mixing-spraying chip. (a) Experimental setup. Two solutions (1 and 2) are injected into the mixing-spraying chip, mixed and reacted for a short, defined time. The mixture solution meets compressed nitrogen gas (Gas) and is sprayed into a plume of droplets. The droplets fly to the EM grid, which is plunging into the cryogen. The resulting grid contains blobs of vitreous ice where the droplets hit the grid surface. (b) Design of the mixer. The two solutions with a total flow rate of 6 µl/s are mixed completely within 0.5 ms in the four tandem butterfly-shaped mixer channels. (c) Design of the different reaction channels. The length of the reaction channel can vary to achieve different reaction times (from 4 to 500 ms) on different chips. Figure adapted from [25,30].
Fig. 3.
Fig. 3.
Ribosome subunit association studied using the mixing-spraying method. (a) Proportions of associated ribosome (70S) and ribosomal large subunit (50S) at various reaction times. (b) Cryo-EM maps of the associated ribosomes in three conformations and the ribosomal large subunit. From left to right: non-rotated ribosome (NR), non-rotated ribosome with swiveled small subunit (30S) head (NRs), rotated ribosome (RT) and 50S subunit. The large subunit is colored in blue/dark gray, and the small subunit is colored in yellow or green/light gray. The 30S head in the NRs ribosome is colored in orange/darker gray to highlight the conformational change. (c) Proportions of the associated ribosomes in three conformations at various times. Figure adapted from [30].
Fig. 4.
Fig. 4.
Schematic to describe the concept of manifold embedding. Each (single-particle) image is represented as a point (a vector end point) in a high-dimensional space. Similarity relationships among images are reflected by proximities among points in this space. In our example the points are clustered along a curved sheet, forming a manifold of lower dimensionality. We like to track relationships along the manifold (curved arrow) irrespective of the Euclidean distance in the high-dimensional space (dashed line). It should be noted that in the case of data without heterogeneity, the point cloud would have a spherical distribution only, reflecting the presence of noise. (Design courtesy by Abbas Ourmazd.)
Fig. 5.
Fig. 5.
Conformational variability and energy landscape of the ribosome. (a) Three views of a cryo-EM map of the 80S ribosome from yeast [72], with arrows and symbols indicating four prominent conformational changes associated with the elongation work cycle of the ribosome (see key on the bottom right). (b) The energy landscape constructed by the manifold embedding technique of Dashti et al. [63], showing the preferred path followed by the ribosome. The color bar shows the energy scale. The energy range has been truncated at 2 kcal/mol to show details of the roughly triangular minimum free-energy trajectory. The error in energy determination along the trajectory is 0.05 kcal/mol. The trajectory is divided into 50 states. The pointers indicate 7 selected minima, each identified by its position in a sequence of the 50 states. Arrows along circle between successive minima indicate combinations of observed conformational changes explained on the left. Figure reproduced from [63].

References

    1. Ludtke S J, Baker M L, Chen D H, Song J L, Chuang D T, Chiu W (2008) De novo backbone trace of GroEL from single particle electron cryomicroscopy. Structure 16: 441–448. - PubMed
    1. Cao E, Liao M, Cheng Y, Julius D (2013) TRPV1 structures in distinct conformations reveal activation mechanisms. Nature 504: 113–118. - PMC - PubMed
    1. Liao M, Cao E, Julius D, Cheng Y (2013) Structure of the TRPV1 ion channel determined by electron cryo-microscopy. Nature 504: 107–112. - PMC - PubMed
    1. Amunts A, Brown A, Bai X C, Llacer J L, Hussain T, Emsley P, Long F, Murshudov G, Scheres S H, Ramakrishnan V (2014) Structure of the yeast mitochondrial large ribosomal subunit. Science 343: 1485–1489. - PMC - PubMed
    1. Brown A, Amunts A, Bai X C, Sugimoto Y, Edwards P C, Murshudov G, Scheres S H, Ramakrishnan V (2014) Structure of the large ribosomal subunit from human mitochondria. Science 346: 718–722. - PMC - PubMed

Publication types

Substances