Species, Abundance and Function of Ammonia-oxidizing Archaea in Inland Waters across China
- PMID: 26522086
- PMCID: PMC4629152
- DOI: 10.1038/srep15969
Species, Abundance and Function of Ammonia-oxidizing Archaea in Inland Waters across China
Abstract
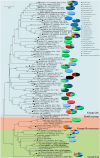
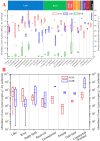
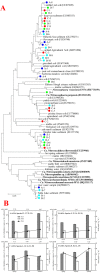
Ammonia oxidation is the first step in nitrification and was thought to be performed solely by specialized bacteria. The discovery of ammonia-oxidizing archaea (AOA) changed this view. We examined the large scale and spatio-temporal occurrence, abundance and role of AOA throughout Chinese inland waters (n = 28). Molecular survey showed that AOA was ubiquitous in inland waters. The existence of AOA in extreme acidic, alkaline, hot, cold, eutrophic and oligotrophic environments expanded the tolerance limits of AOA, especially their known temperature tolerance to -25 °C, and substrate load to 42.04 mM. There were spatio-temporal divergences of AOA community structure in inland waters, and the diversity of AOA in inland water ecosystems was high with 34 observed species-level operational taxonomic units (OTUs; based on a 15% cutoff) distributed widely in group I.1b, I.1a, and I.1a-associated. The abundance of AOA was quite high (8.5 × 10(4) to 8.5 × 10(9) copies g(-1)), and AOA outnumbered ammonia-oxidizing bacteria (AOB) in the inland waters where little human activities were involved. On the whole AOB predominate the ammonia oxidation rate over AOA in inland water ecosystems, and AOA play an indispensable role in global nitrogen cycle considering that AOA occupy a broader habitat range than AOB, especially in extreme environments.
Conflict of interest statement
The authors declare no competing financial interests.
Figures


Similar articles
-
Temporal and spatial distributions of ammonia-oxidizing archaea and bacteria and their ratio as an indicator of oligotrophic conditions in natural wetlands.Water Res. 2012 Sep 1;46(13):4121-9. doi: 10.1016/j.watres.2012.05.007. Epub 2012 May 15. Water Res. 2012. PMID: 22673339
-
Shifts between ammonia-oxidizing bacteria and archaea in relation to nitrification potential across trophic gradients in two large Chinese lakes (Lake Taihu and Lake Chaohu).Water Res. 2013 May 1;47(7):2285-96. doi: 10.1016/j.watres.2013.01.042. Epub 2013 Feb 16. Water Res. 2013. PMID: 23473400
-
Diversity and community structure of ammonia oxidizers in a marsh wetland of the northeast China.Appl Microbiol Biotechnol. 2018 Oct;102(19):8561-8571. doi: 10.1007/s00253-018-9225-9. Epub 2018 Jul 20. Appl Microbiol Biotechnol. 2018. PMID: 30030565
-
[Ammonia-oxidizing archaea and their important roles in nitrogen biogeochemical cycling: a review].Ying Yong Sheng Tai Xue Bao. 2010 Aug;21(8):2154-60. Ying Yong Sheng Tai Xue Bao. 2010. PMID: 21043129 Review. Chinese.
-
Diversity, physiology, and niche differentiation of ammonia-oxidizing archaea.Appl Environ Microbiol. 2012 Nov;78(21):7501-10. doi: 10.1128/AEM.01960-12. Epub 2012 Aug 24. Appl Environ Microbiol. 2012. PMID: 22923400 Free PMC article. Review.
Cited by
-
Effects of environmental variables on abundance of ammonia-oxidizing communities in sediments of Luotian River, China.PeerJ. 2020 Jan 6;8:e8256. doi: 10.7717/peerj.8256. eCollection 2020. PeerJ. 2020. PMID: 31934502 Free PMC article.
-
Identification of key microorganisms in facultative stabilization ponds from dairy industries, using metagenomics.PeerJ. 2022 Mar 14;10:e12772. doi: 10.7717/peerj.12772. eCollection 2022. PeerJ. 2022. PMID: 35310160 Free PMC article.
-
Resuscitation of anammox bacteria after >10,000 years of dormancy.ISME J. 2019 Apr;13(4):1098-1109. doi: 10.1038/s41396-018-0316-5. Epub 2018 Nov 30. ISME J. 2019. PMID: 30504897 Free PMC article.
-
Nitrification mainly driven by ammonia-oxidizing bacteria and nitrite-oxidizing bacteria in an anammox-inoculated wastewater treatment system.AMB Express. 2021 Nov 27;11(1):158. doi: 10.1186/s13568-021-01321-6. AMB Express. 2021. PMID: 34837527 Free PMC article.
-
Monthly distribution of ammonia-oxidizing microbes in a tropical bay.J Microbiol. 2021 Jan;59(1):10-19. doi: 10.1007/s12275-021-0287-5. Epub 2020 Nov 17. J Microbiol. 2021. PMID: 33201437
References
-
- Stahl D. A. & de la Torre J. R. Physiology and diversity of ammonia-oxidizing archaea. Annu. Rev. Microbiol. 66, 83–101 (2012). - PubMed
-
- Wang S., Wang Y., Feng X., Zhai L. & Zhu G. Quantitative analyses of ammonia-oxidizing Archaea and bacteria in the sediments of four nitrogen-rich wetlands in China. Appl. Microbiol. Biotechnol. 90, 779–787 (2011). - PubMed
-
- Winogradsky S. Recherches sur les organismes de la nitrification. Ann. Inst. Pasteur 4, 11–12 (1890).
-
- Monteiro M., Séneca J. & Magalhães C. The history of aerobic ammonia oxidizers: from the first discoveries to today. J. Microbiol. 52, 537–547 (2014). - PubMed
-
- Kowalchuk G. A. & Stephen J. R. Ammonia-oxidizing bacteria: a model for molecular microbial ecology. Annu. Rev. Microbiol. 55, 485–529 (2001). - PubMed
Publication types
MeSH terms
Substances
LinkOut - more resources
Full Text Sources
Other Literature Sources

