. 2015 Nov 5;163(4):866-79.
doi: 10.1016/j.cell.2015.10.017. Epub 2015 Oct 29.

Relaxation of Loaded ESCRT-III Spiral Springs Drives Membrane Deformation

Affiliations

Relaxation of Loaded ESCRT-III Spiral Springs Drives Membrane Deformation

Nicolas Chiaruttini et al. Cell. .

Abstract

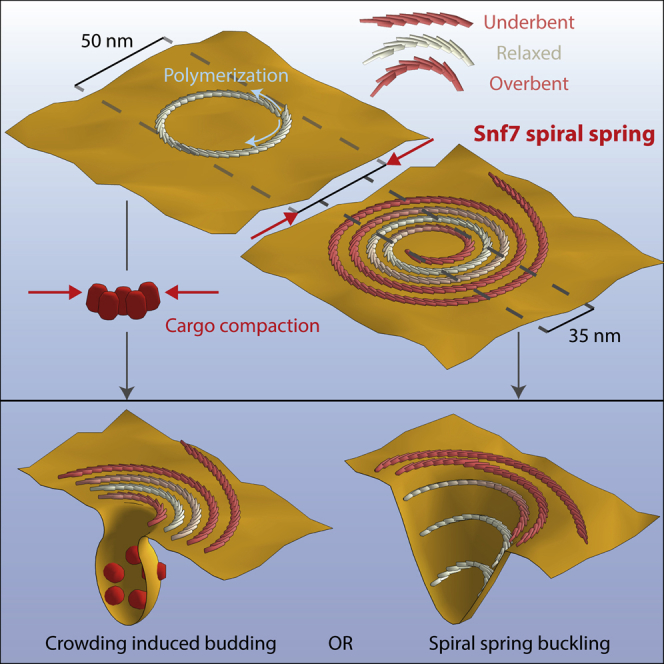
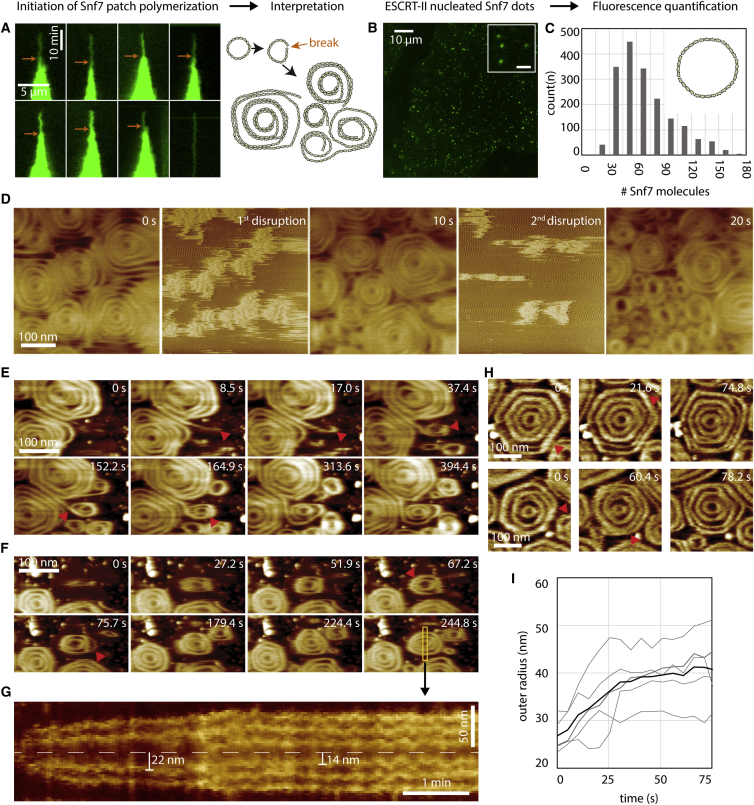
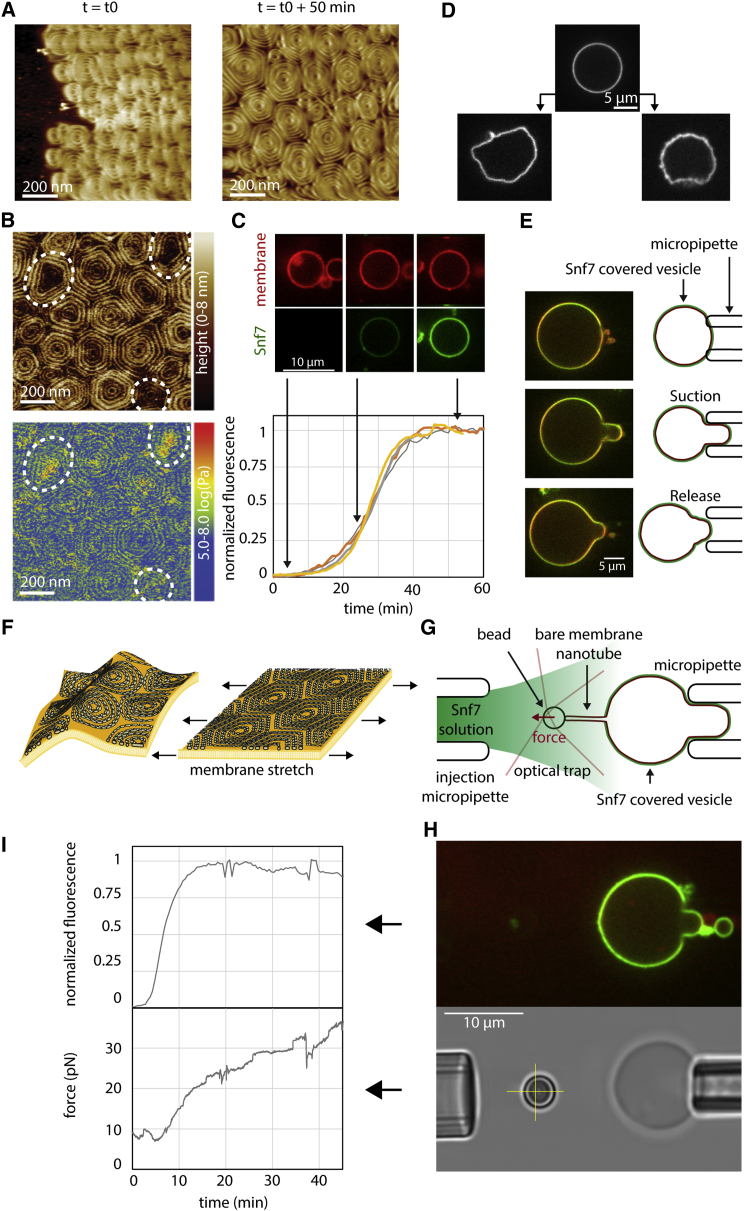
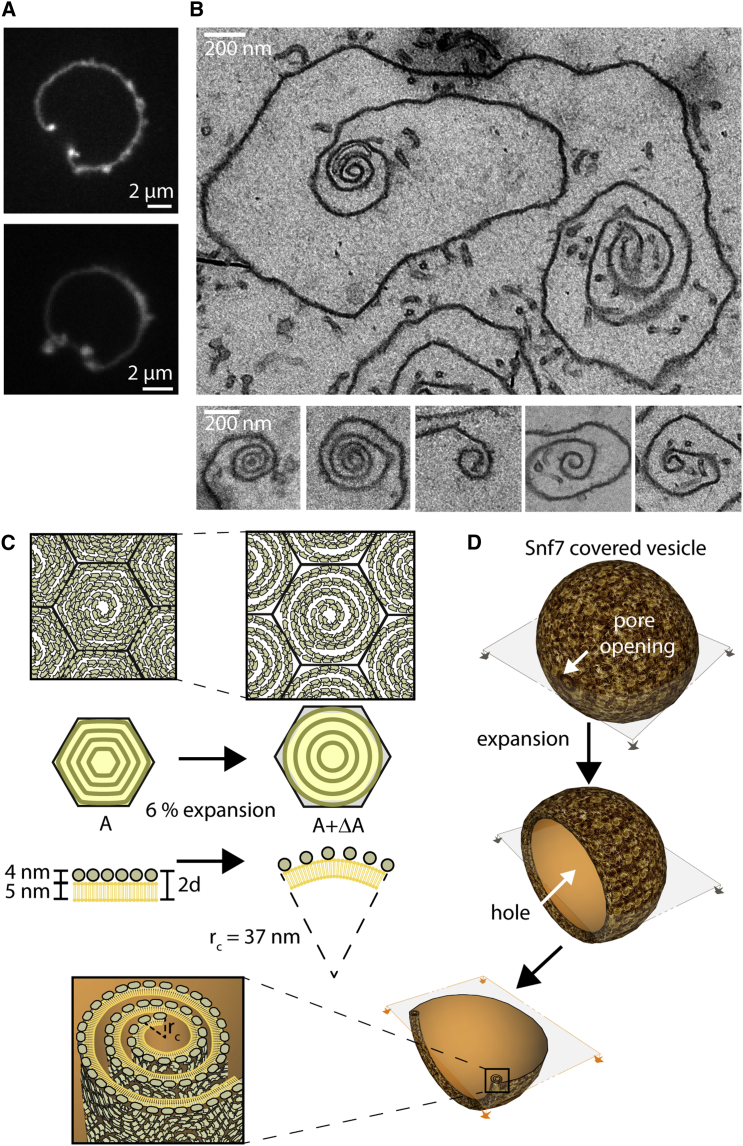
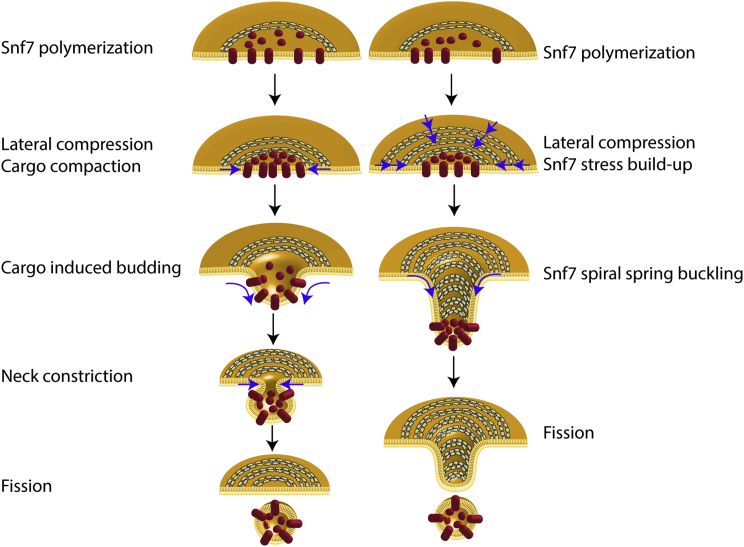
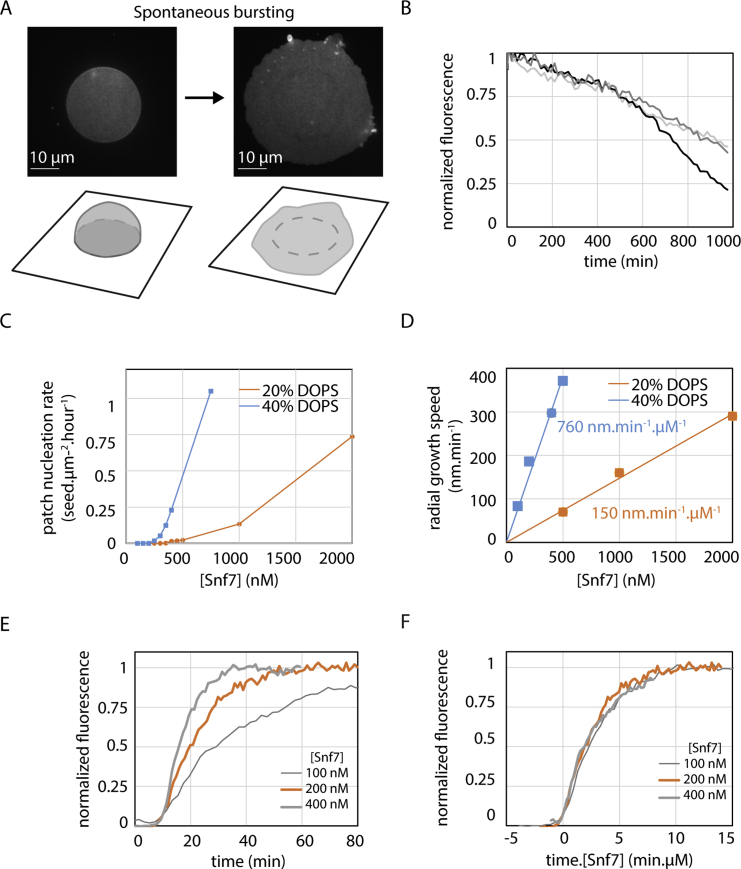
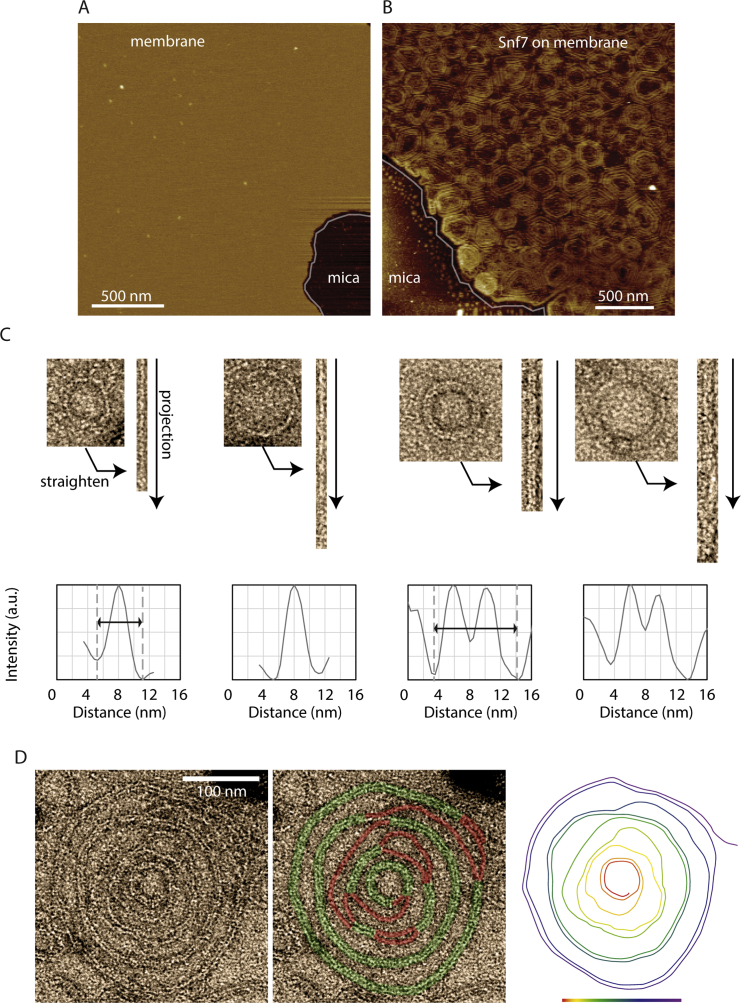
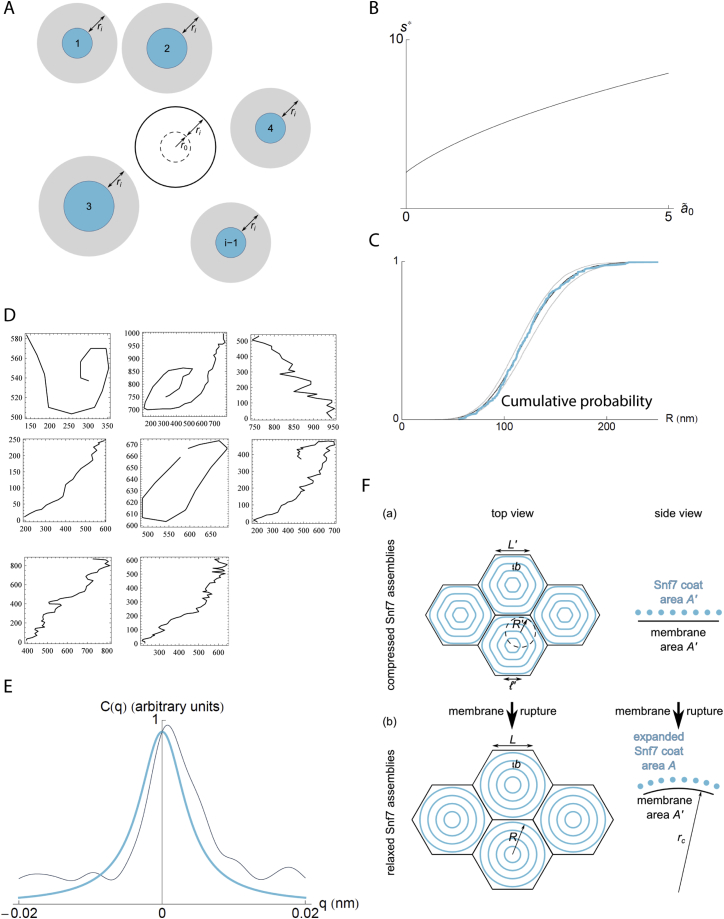
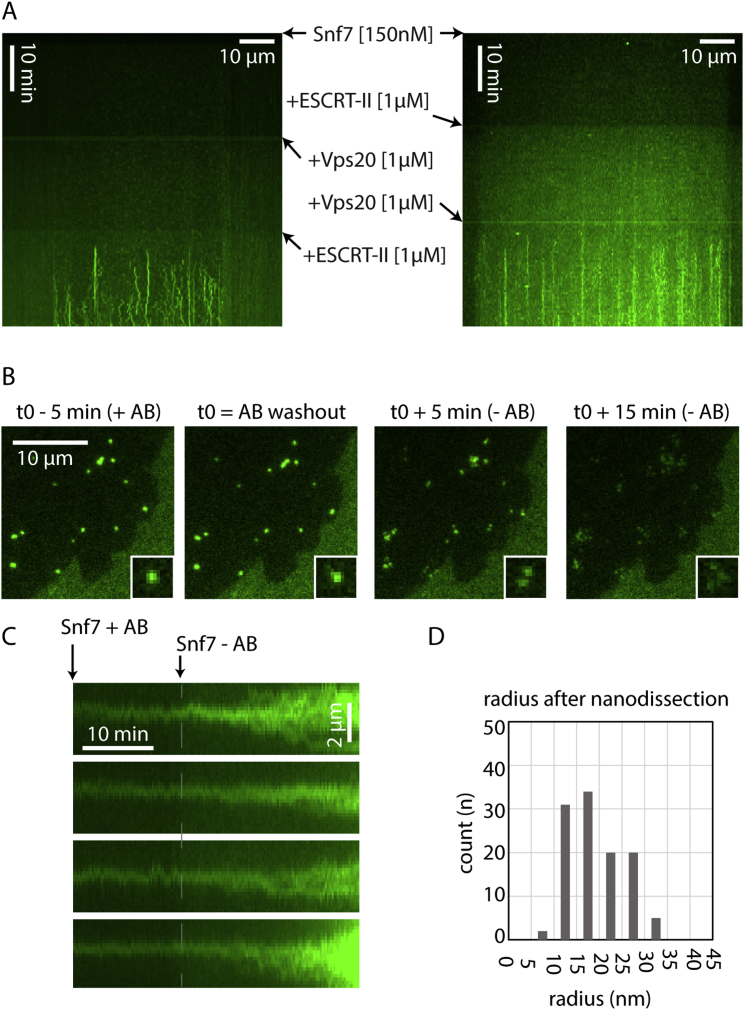
ESCRT-III is required for lipid membrane remodeling in many cellular processes, from abscission to viral budding and multi-vesicular body biogenesis. However, how ESCRT-III polymerization generates membrane curvature remains debated. Here, we show that Snf7, the main component of ESCRT-III, polymerizes into spirals at the surface of lipid bilayers. When covering the entire membrane surface, these spirals stopped growing when densely packed: they had a polygonal shape, suggesting that lateral compression could deform them. We reasoned that Snf7 spirals could function as spiral springs. By measuring the polymerization energy and the rigidity of Snf7 filaments, we showed that they were deformed while growing in a confined area. Furthermore, we observed that the elastic expansion of compressed Snf7 spirals generated an area difference between the two sides of the membrane and thus curvature. This spring-like activity underlies the driving force by which ESCRT-III could mediate membrane deformation and fission.


Figures

None
Graphical abstract
Figure 1
Figure 1
Nucleation and Growth of Snf7 Patches on Supported Membranes Lipid composition is DOPC 60% / DOPS 40%+ Rhodamine PE 0.1%. (A) Time-lapse images of Snf7-Alexa488 patches growth (green) at [Snf7] = 400 nM on supported membrane (gray). (B) Time-lapse images (every 10 min) of a single Snf7-Alexa488 patch (green) growing at [Snf7] = 200 nM. (C) Patch nucleation rate as a function of [Snf7]. (D) Successive (from bright to dark green, every 10 min) Snf7 patch fluorescence profiles (circularly averaged) at [Snf7] = 200 nM. (E) Snf7 patch edge fluorescence profile (average of 3 patches) as a function of [Snf7] (data for [Snf7] < 200 nM were obtained by first nucleating the patches at 350 nM for 5 min, and then [Snf7] was reduced to the desired value). (F) Exchange of bulk Snf7-Alexa488 (green) with Snf7-Atto647N (red) at 200 nM. Inset: kymograph of the region selected (yellow box). The green line is the switch between green and red Snf7. (G) Equatorial kymograph of the patch shown in B. (H) Patch radial growth speed as a function of [Snf7]. The slope of the linear fit (gray line) is 760 nm.min−1.μM−1. See also Figure S1.
Figure 2
Figure 2
Patches Are Made of Packed Snf7 Spirals (A) AFM topographic image of the center of a Snf7 patch. (B) Histogram of the number of neighbors per assembly. (C) Histogram of the average outer radii of Snf7 assemblies. The average radius is 123 nm ± 33 nm. (D) Histogram of the innermost circle radii. The average radius is 18 nm ± 3 nm. (E) Histogram of the inter-circle distance. The average distance is b = 17 nm ± 3 nm. (F) TEM image of a negatively stained, Snf7-coated LUV. (G) TEM images of Snf7 rings, single (upper row) and double (lower row) stranded. (H) Top: TEM image of a single Snf7 spiral. The Snf7 filament is underlined in green (resp. red) when double stranded (resp. single stranded). Bottom: color code of the filament path from the most inner turn (red) to the most outer turn (purple). See also Figure S2D. (I) AFM images of connections between filaments: 1 to 3, split filaments connecting two spirals – 4 and 5, filament split within a spiral – 6, a spiral filament. (J) High resolution AFM topographic image of Snf7 filament splitting and branching within a single Snf7 spiral. See also Figure S2.
Figure 3
Figure 3
Modeling of Snf7 Patch Growth (A) A putative scenario for the nucleation and growth of Snf7 spirals into a patch: new spirals are formed from filaments protruding from pre-existing spirals. The new spirals separate from the mother spiral by filament break. (B) Schematic of the theoretical model for Snf7 patch growth. Snf7 spirals are represented by disks. Disks are created with an initial radius r0. Their area grows with a constant rate (w), which leads to a radius growing as the square root of time (upper graph and black curves). New spirals are nucleated over time proportionally to the spiral nucleation rate λ and to the total perimeter of existing disks. (C) Pictorial representations of a small membrane area being covered with Snf7 disks at the beginning (left) and at the end (right) of the growth process. (D) Cumulative distribution of spiral sizes (dots, calculated from Figure 2C) fitted with our theoretical model (line), imposing r0 = 25 nm. The single fit parameter (w/λ) is equal to 9.8×103 μm3.
Figure 4
Figure 4
Nucleation and Growth of Snf7 Spirals on Supported Membranes (A) Left: TIRF microscopy kymographs of the nucleation of single Snf7 patches (green) at [Snf7] = 300 nM. Arrows indicate single ring to multiple spirals transition as postulated from the interpretation of these observations (right). (B) TIRF microscopy image of Snf7-Alexa488 dots (green) nucleated by ESCRT-II, [Snf7] = 75 nM, [Vps20] = 1 μM, [ESCRT-II] = 1 μM. Inset: zoom on 4 diffraction-limited spots (scale bar, 2 μm). (C) Histogram of the estimated number of Snf7 molecules within the dots nucleated by ESCRT-II (n = 1856). (D) HS-AFM nanodissection experiment (see text) of Snf7 spirals. 2 cycles of high AFM force were applied, between 0 s and 10 s, and between 10 s and 20 s. (E) HS-AFM time-lapse sequence showing the apparition of a new Snf7 spiral from pre-existing ones. Arrowheads show: filament protruding from a spiral (t = 8.5 s), filament curling from its tip (t = 17.0 s), and forming a small spiral (t = 37.4 s), growth of a second turn in the spiral (t = 152.2 s) and filament rearrangements (t = 164.9 s). (F) HS-AFM time-lapse sequence of an isolated Snf7 spiral. Arrowheads show: growth of the spiral at the two-turn stage (t = 67.2 s), and filament split (t = 75.7 s) leading to the three turns stage. (G) The equatorial kymograph (yellow rectangle) of this growing spiral: the innermost turn radius decreases from 22 nm to 14 nm upon formation of the third turn. (H) Dynamics of filament splitting and fusing in two Snf7 spirals (rows) observed by HS-AFM. Arrowheads show displacement of the splitting points. (I) Time plot of the outer radius of five growing Snf7 spirals followed by HS-AFM. The origin of all curves is the apparition of the first turn. The thick curve is the average of all curves. [Snf7] = 1 μM. See also Figure S4.
Figure 5
Figure 5
Build-up of Lateral Compression in Snf7 Spirals by Polymerization (A) HS-AFM images of Snf7 spirals acquiring polygonal shapes with time. (B) AFM Topography and nanomechanical mapping of polygonal Snf7 spirals. A significant proportion of spirals (dashed outlines) have a lower center with increased mechanical stiffness. (C) Snf7 polymerization on GUVs made of DOPC 60% / DOPS 40% + Rhodamine-PE 0.1% (red), 0.003% DOPE-Peg2000-Biotin. GUVs are incubated with 500 nM Snf7-Alexa488 (green). Top: SDC images of a GUV equatorial plane during Snf7 polymerization. Bottom: fluorescence intensity (equatorial plane) of 4 GUVs with time. (D) GUVs before (top) and after (bottom) several hours of incubation with Snf7-Alexa488. (E) Snf7 coated GUVs keep the aspirated shape after release from the micropipette. (F) Sketch of membrane stretching by Snf7 spiral compression. (G) Schematic of the membrane tension measurement setup combining holding pipette, injection pipette, bead within an optical trap, giant vesicle (red) and Snf7 (green). (H) Top image: SDC image of a membrane tension measurement experiment (red = membrane, green = Snf7-Alexa488). Note that Snf7-Alexa488 did not polymerize on the membrane nanotube. Bottom: brightfield image of the same vesicle. The yellow cross indicates the resting position of the bead held by the optical trap. (I) Top: Normalized Snf7 fluorescence intensity versus time (measured from equatorial plane); bottom: force exerted by the membrane nanotube on the bead versus time. See also Figure S5.
Figure 6
Figure 6
Snf7 Lateral Pressure and Expansion Induced Membrane Deformations (A) Confocal sections of Snf7 coated vesicles displaying stable holes. Fluorescence is more intense at the rim of the pore. (B) EM thin section image of a Snf7 coated vesicle with a stable pore. Note the curling of the membrane rim. Several other examples of membrane curling are shown in lower panels. (C) Sketch of the expected curvature generated by expansion of compressed Snf7 spirals. (D) Sketch of the pore opening and curling of Snf7 coated vesicle. Bottom images show the expected section of a stable pore in the GUV and a zoom on the membrane curled region.
Figure 7
Figure 7
Models of ESCRT-III Mediated Budding and Fission of Intra-lumenal Vesicles Left: cargo sequestration and ESCRT-III lateral compression induces membrane budding. Further ESCRT-III narrowing might lead to fission. Right: ESCRT-III lateral compression leads to buckling.
Figure S1
Figure S1
Dynamics of Snf7 Patches on Supported Membranes, Related to Figure 1 (A) GUV bursting on glass coverslip. Left: GUV before bursting. A strongly adhered GUV, labeled with Rhodamine-PE, is visualized by spinning-disk confocal microscopy. The focus is made on the bottom of the vesicle, showing the circular patch of adhesion. Below is the 3D sketch showing the strongly adhered vesicle. Right: Same vesicle shortly after bursting occurred and corresponding sketch. See also Movie S1. (B) Spontaneous Snf7 patch depolymerization after Snf7 washout in solution. The curves represent different locations where depolymerization is measured. See also Movie S3. (C) Patch nucleation rate as a function of [Snf7] for a DOPC 60% / DOPS 40% membrane (blue curve) and for a DOPC 80% / DOPS 20% membrane (orange curve). (D) Patch radial growth speed as a function of [Snf7] for a DOPC 60% / DOPS 40% membrane (blue curve) and for a DOPC 80% / DOPS 20% membrane (orange curve). Lines are linear fit with the slope equals to 760 nm.min−1.μM−1 (blue) and 150 nm.min−1.μM−1 (orange). (E) Fluorescence intensity curve (average of 5 patches) with time at a given point on the membrane upon coverage by a Snf7 patch, for [Snf7] = 100 nM (thin gray line), 200 nM (orange line), 400 nM (thick gray line). (F) Same curves as (E) plotted as a function of time multiplied by Snf7 concentration in μM. All graphs merge on one single master curve, revealing that the coverage dynamics is proportional to Snf7 bulk concentration.
Figure S2
Figure S2
Filamentous Structure of Snf7 Patches, Related to Figure 2 (A) Bare membrane bursted on mica visualized by AFM. The membrane is partially covering the mica support (edge underlined in gray). (B) Membrane partially covering the mica surface (frontier shown as a gray line) fully covered by packed Snf7 spirals. (C) Estimation of Snf7 filament thickness by EM. Two representative example of single-stranded rings and double-stranded rings are straighten and averaged along their path to reveal single filament or double filament thickness. Their thickness is measured as the well to well distance (arrows). (D) TEM image of a single Snf7 disk negatively stained, another example of Figure 2H. Left: raw data. Middle: the Snf7 filament is underlined in green (resp. red) when double stranded (resp. single stranded). Right: interpretation of EM picture as a single Snf7 spiraling filament, color coded along its path from red to purple.
Figure S3
Figure S3
Mathematical Modeling of Snf7 Growth and Mechanics, Related to Figure 3 (A) Mean-field disk addition scheme. We consider the addition of a new disk of radius ri that does not overlap with any of the blue disks numbered from 1 to i-1 (i.e., we assume that its center falls outside of the gray circles). We evaluate the probability that this disk does not interfere with the intended nucleation site, which we represent as a dashed circle. This is equivalent to computing the probability that its center falls outside of the solid black circle. (B) Plot of the solution of Equation 16 of the Supplemental Information, Supplemental Mathematical Modeling. (C) Fit between the numerical and experimental cumulative disk radius distribution. Blue line: experimental data used in Figure 3D of the main text; black line: best fit, ã0 = 0.043; gray lines: significantly worse fits obtained by altering this value by ± 10%, providing a measure of the uncertainty of the fit. (D) Polymer profiles observed by AFM (coordinates in nanometers). (E) Correlation function C(q) as a function of wavevector q: experimental measurement (black) and theoretical expression (Equation 24) with parameters lp and α determined through Equation 25 (blue). (F) Deformed (a) and relaxed (b) coat shapes considered in section 3 of Supplemental Information, Supplemental Mathematical Modeling and resulting membrane curvature.
Figure S4
Figure S4
Nucleation and Disruption of Snf7, Related to Figure 4 All images are acquired with TIRF Microcopy. (A) Control of Snf7 polymerization induced by ESCRT-II and Vps20 proteins. Kymograph of a membrane slice over time. Fluorescents dots appear as lines when Snf7 nuclei are polymerized. Lines appear only when both Vps20 and ESCRT-II are present (both kymograph, lower panel). Snf7 and Vps20 without ESCRT-II (left kymograph middle panel) as well as Snf7 and ESCRT-II without Vps20 (right kymograph middle panel) do not nucleate Snf7 filaments. (B) Photobleaching induces breaks in Snf7 dotted structures. Snf7 dots are formed by incubation of Snf7 at 300 nM for 1 hr on DOPC 60% /DOPS 40% membrane. Snf7 is then washed out. Snf7 dots are subsequently imaged at a high frequency (1 fps) and under long exposure time and high laser power. When an antibleaching solution (AB) is present in the chamber, the dots remain intact (first and second image). However 5 min and 15 min after the antibleaching solution is washed out (third and fourth image), dots are disrupted into wider structures showing multiple maxima (see 2 × 2 μm insets for details). Structures located outside the imaged field of view are not affected by the removal of the antibleaching solution. (C) Photobleaching triggers patch formation from Snf7 dots. Compared to (B), Snf7 is maintained in the chamber at 300 nM throughout the experiment. In this case, the removal of the antibleaching solution (Snf7 - AB point of the kymograph) synchronously triggers the transition from Snf7 dots to patches. (D) Histogram of the Snf7 filament radius distribution after nanodissection (total of three experiments, see Figure 4D).
Figure S5
Figure S5
Using GUVs to Study Snf7 Mechanics, Related to Figure 5 (A) Partially adhered GUVs within a flow chamber. Top left: experimental setup to follow partially adhered vesicles within a flow chamber. A coverslip (blue-gray) is coated with avidin (orange) by adsorption. GUVs (red) containing peg-biotin lipids (black arrows) are flowed within the chamber and attach to the glass surface. Passivation of the surface is then made by flowing biotinylated bsa, allowing to keep for long time partially adhered vesicles. Bottom left: GUVs images taken at the coverslip surface showing the adhesion patch of vesicles. Bottom middle: equatorial section of GUVs. Side images: Y-Z and X-Z sections (dashed line) reconstructed from Z optical sections. (B) Comparison between patch coverage dynamics and GUV coverage dynamics. Gray: dynamics equals to the average of 4 GUVs shown Figure 5C. Orange: equivalent to graphs shown Figure S1E for [Snf7] = 500 nM. The initial dynamics is steeper for Snf7 patches but the saturation dynamics is similar. (C) Comparison of the dynamics of surface coverage between GUVs experiments and the mathematical modeling. Orange: dynamics equals to the average of 4 GUVs shown Figure 5C. Gray: result of the mathematical modeling for [Snf7] = 500 nM (w = 40 nm2.s−1 and λ = 8.2 × 10−3 spiral.μm−1.s−1). (D) Plastic behavior of strongly coated vesicle, another example of Figure 5E. A round shaped vesicle is being held gently by a pipette (left), then a suction pressure is exerted (middle) to deform the vesicle. Upon pressure release (right), the vesicle keeps the shape of the pipette. (E) Membrane bending rigidity (κ) measurement of a DOPC 60% / DOPS 40% vesicle. Plot of the tether force squared as a function of experimentally imposed membrane tension for the vesicle shown in Figure 5H and 5I. The variation is linear with an expected slope of 8π2κ. The linear fit yields the bending rigidity κ=12kbT=4.8×10²⁰ J.
Figure S6
Figure S6
Microscope Calibration with Labeled DNA Origamis, Related to Experimental Procedures DNA origamis are labeled with Atto-647N (GATTAquant Brightness 9R: 9 Atto-647N molecules and GATTAquant Brightness 18R: 18 Atto-647N molecules). (A) Fluorescence histograms of diffraction limited fluorescent spots (see B) of GATTA-Brightness 9R (blue, n = 985) and GATTA-Brightness 18R (orange, n = 892). (B) Typical field of view of adhered DNA origamis appearing as diffraction limited spots. (C) and (D) Average fluorescence of DNA origamis spots (9R, blue and 18R, orange), varying linearly with laser power (expressed in percentage of maximal output) in (C) and with exposure time in (D). Error bars are SD of each fluorescence distribution measured.

Comment in

  • ESCRT Filaments as Spiral Springs.
    Carlson LA, Shen QT, Pavlin MR, Hurley JH. Carlson LA, et al. Dev Cell. 2015 Nov 23;35(4):397-8. doi: 10.1016/j.devcel.2015.11.007. Dev Cell. 2015. PMID: 26609952

References

    1. Adell M.A.Y., Vogel G.F., Pakdel M., Müller M., Lindner H., Hess M.W., Teis D. Coordinated binding of Vps4 to ESCRT-III drives membrane neck constriction during MVB vesicle formation. J. Cell Biol. 2014;205:33–49. - PMC - PubMed
    1. Babst M., Katzmann D.J., Estepa-Sabal E.J., Meerloo T., Emr S.D. Escrt-III: an endosome-associated heterooligomeric protein complex required for mvb sorting. Dev. Cell. 2002;3:271–282. - PubMed
    1. Bissig C., Gruenberg J. ALIX and the multivesicular endosome: ALIX in Wonderland. Trends Cell Biol. 2014;24:19–25. - PubMed
    1. Buchkovich N.J., Henne W.M., Tang S., Emr S.D. Essential N-terminal insertion motif anchors the ESCRT-III filament during MVB vesicle formation. Dev. Cell. 2013;27:201–214. - PubMed
    1. Callan-Jones A., Albarran Arriagada O.E., Massiera G., Lorman V., Abkarian M. Red blood cell membrane dynamics during malaria parasite egress. Biophys. J. 2012;103:2475–2483. - PMC - PubMed

Publication types

MeSH terms

Substances

LinkOut - more resources