. 2015 Nov 17;43(5):998-1010.
doi: 10.1016/j.immuni.2015.09.012. Epub 2015 Oct 27.

The Intestinal Microbiota Contributes to the Ability of Helminths to Modulate Allergic Inflammation

Affiliations

The Intestinal Microbiota Contributes to the Ability of Helminths to Modulate Allergic Inflammation

Mario M Zaiss et al. Immunity. .

Abstract

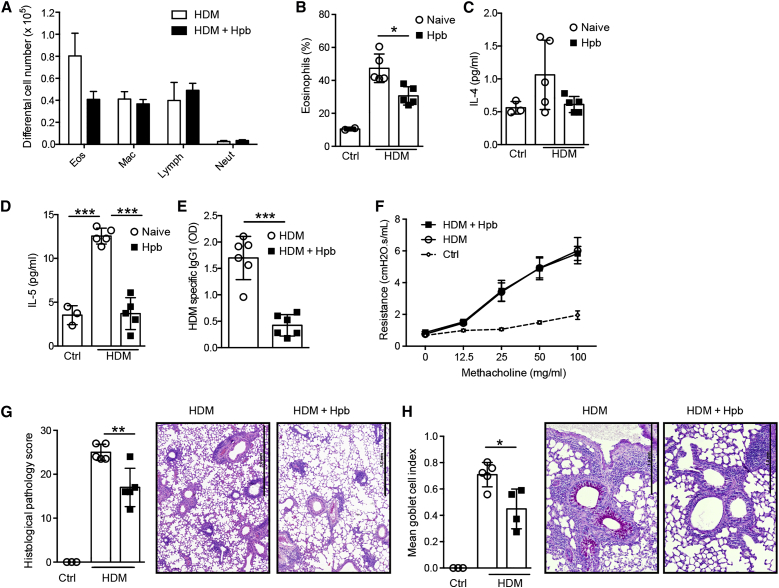
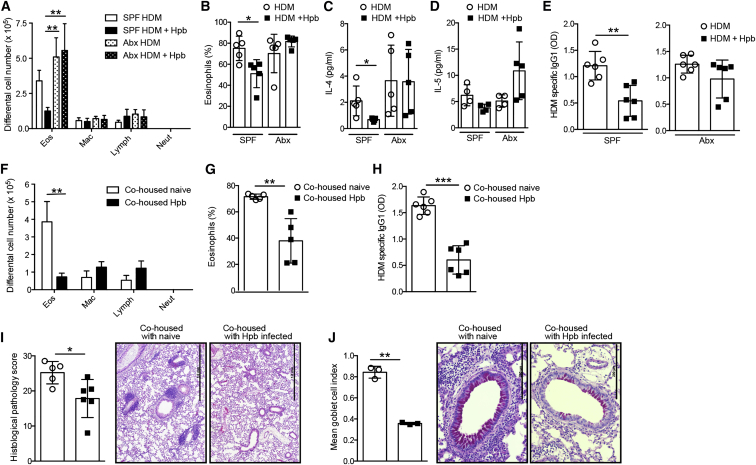
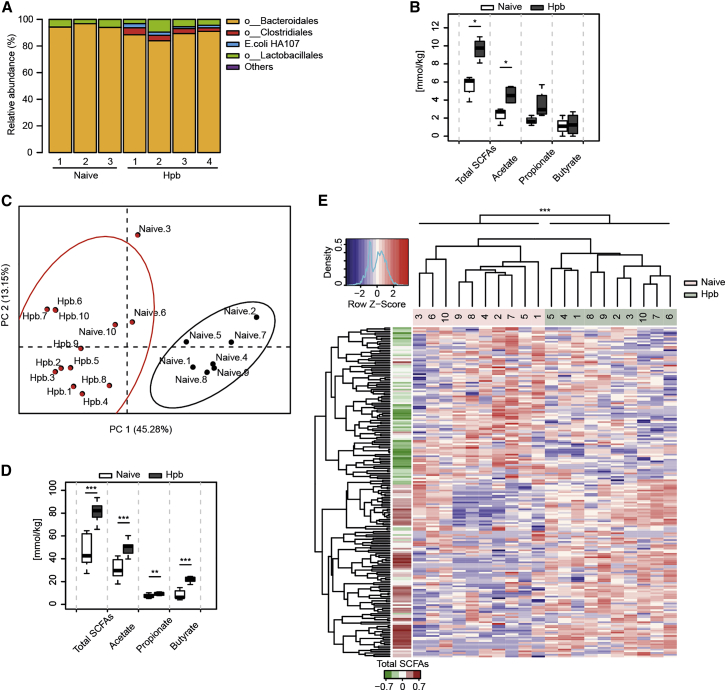
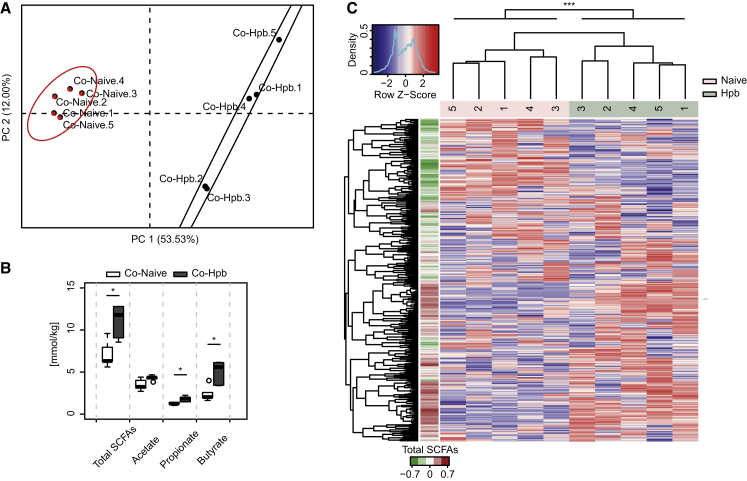
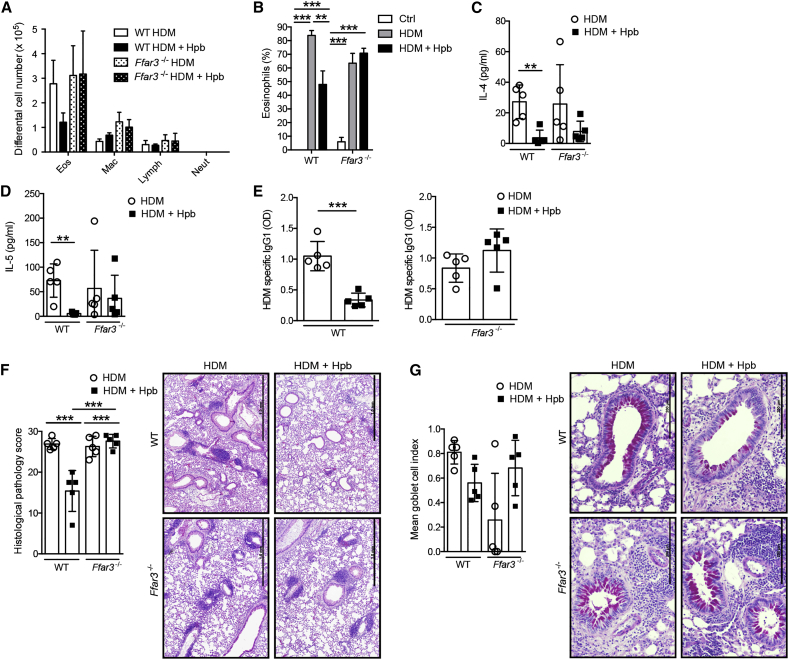
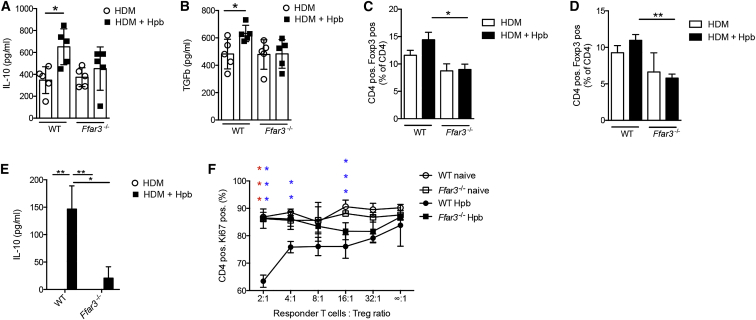
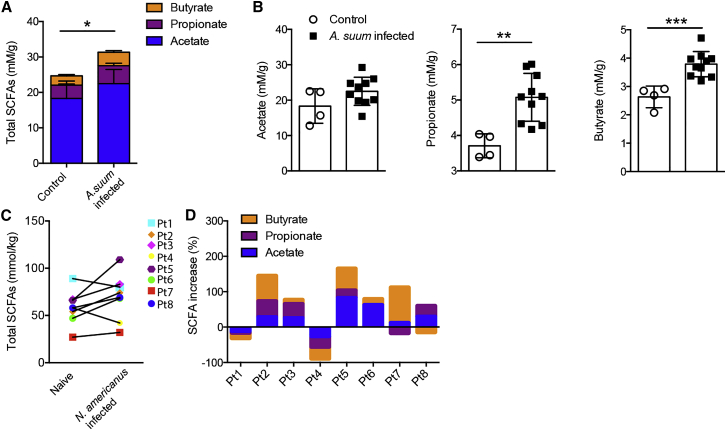
Intestinal helminths are potent regulators of their host's immune system and can ameliorate inflammatory diseases such as allergic asthma. In the present study we have assessed whether this anti-inflammatory activity was purely intrinsic to helminths, or whether it also involved crosstalk with the local microbiota. We report that chronic infection with the murine helminth Heligmosomoides polygyrus bakeri (Hpb) altered the intestinal habitat, allowing increased short chain fatty acid (SCFA) production. Transfer of the Hpb-modified microbiota alone was sufficient to mediate protection against allergic asthma. The helminth-induced anti-inflammatory cytokine secretion and regulatory T cell suppressor activity that mediated the protection required the G protein-coupled receptor (GPR)-41. A similar alteration in the metabolic potential of intestinal bacterial communities was observed with diverse parasitic and host species, suggesting that this represents an evolutionary conserved mechanism of host-microbe-helminth interactions.


Figures

Figure 1
Figure 1
Infection with the Intestinal Helminth Hpb Attenuates Allergic Airway Inflammation C57BL/6 SPF mice were infected or not with Hpb, then subjected to HDM sensitization and challenge. Mice were sacrificed 3 days after the final HDM challenge and the severity of airway inflammation was determined. (A) Differential cell counts in the broncho-avleolar lavage fluid (BALF). Abbreviations are as follows: mac, macrophages; neut, neutrophils; eos, eosinophils; lymph, lymphocytes. (B) Percent eosinophils within BALF cells. (C –E) Concentrations of (C) IL-4 and (D) IL-5 cytokines within the BALF and (E) HDM-specific IgG1 in the serum. Abbreviation is as follows: OD, optical density. (F) Measurement of AHR, as assessed by airway resistance to increasing doses of methacholine. (G) Mean gross lung histological pathology scores with representative pictures from H&E-stained lung tissue. Scale bars represent 1 mm. (H) Mean goblet cell index with representative periodic acid-Schiff-stained lung tissue. Scale bars represent 1 mm. Data are expressed as the mean ± SD (n = 3 control mice and min. n = 5 mice treated with HDM extract). Each symbol represents an individual mouse. Statistical significance was determined with one-way analysis of variance (ANOVA), p < 0.05, ∗∗p < 0.01, ∗∗∗p < 0.001. Data are from one experiment and are representative of two (F) or three (A–E, G, and H) independent experiments.
Figure 2
Figure 2
The Gut Microbiota Is Essential to Attenuate Allergic Airway Inflammation during Hpb Infection (A–E) Antibiotic-treated or untreated SPF C57BL/6 mice were infected or not with Hpb, then subjected to HDM sensitization and challenge. Mice were sacrificed 3 days after the final HDM challenge and the severity of airway inflammation was determined. (A) Differential cell counts in the BALF. Abbreviations are as follows: mac, macrophages; neut, neutrophils; eos, eosinophils; lymph, lymphocytes. (B) Percent eosinophils within BALF cells. (C and D) Concentrations of (C) IL-4 and (D) IL-5 cytokines within the BALF. (E) Measurements of HDM-specific IgG1 in the serum. Abbreviation is as follows: OD, optical density. (F–J) Antibiotic-treated recipient mice were co-housed with naive or Hpb-infected donors for 3 weeks, then subjected to HDM sensitization and challenge. Mice were sacrificed 3 days after the final HDM challenge and the severity of inflammation determined. (F) Differential cell counts in the BALF. (G) Percent of eosinophils of cells in the BALF. (H) Measurement of HDM-specific IgG1 in the serum. (I) Mean gross lung histological pathology scores with representative pictures of H&E-stained lung tissue. Scale bars represent 1 mm. (J) Mean goblet cell index with representative pictures of periodic acid-Schiff-stained lung tissue. Scale bars represent 200 μm. Data are expressed as the mean ± SD (n = 5 mice). Each symbol represents an individual mouse. Statistical significance was determined with two-way analysis of variance (ANOVA) (A–D, F) or Student’s t test, p < 0.05, ∗∗p < 0.01, ∗∗∗p < 0.001. Data are from one experiment and are representative of three independent experiments. See also Figure S1.
Figure 3
Figure 3
Hpb Infection Alters the Cecal Microbiota and Increases SCFA Concentrations (A and B) ASF mice were infected with Hpb, cecal contents were collected, and bacterial community was analyzed by the 16S rRNA gene sequencing method. (A) Cecal bacterial community composition at the order level. Results show OTUs relative abundances for individual mice from one experiment with n = 7 naive or Hpb-infected individuals. (B) Cecal SCFA concentrations from the mice shown in (A). Significance was determined by unpaired Student’s test. (C–E) SPF mice were infected with Hpb, cecal contents were collected 42 days later, and the 16S rRNA genes were amplified and sequenced. (C) Principal coordinates analysis (PCoA) using the Bray-Curtis dissimilarity based on OTU abundances. Color clustering is based on the k-means method. Results show individual mice from one experiment with n = 20 naive or Hpb-infected mice (2 cages per group). (D) Cecal SCFA concentrations from the mice depicted in (C). Significance was determined by unpaired Student’s test. (E) OTU abundance heatmap from (C). The left color bar represents the Spearman correlation coefficient of each OTU with the total cecal SCFA concentrations. Hierarchical clustering based on the Spearman correlation coefficient was applied to order samples and OTUs. Significance was determined by the Adonis method (p < 0.05, ∗∗p < 0.01, ∗∗∗p < 0.001). Data are from one experiment except for (D), where they are representative of five independent experiments. Data in (B) and (D) were generated with R boxplot with the middle bar representing the median and whiskers showing 1.5× inter-quartile range (IQR). See also Figure S2.
Figure 4
Figure 4
Hpb-Altered Microbial Communities with Increased Potential for SCFA Production Can Be Transferred to Naive Mice Antibiotic-treated recipient mice were co-housed for 3 weeks with naive SPF or Hpb-infected mice, cecal contents were collected, and the 16S rRNA genes amplified and sequenced. (A) Principal coordinates analysis (PCoA) using the Bray-Curtis dissimilarity based on OTU abundances. Color clustering is based on the k-means method. Results show individual mice from one experiment with n = 5 mice per group. (B) Cecal SCFA concentrations from the mice depicted in (A). Significance was determined by unpaired Student’s t test. (C) OTU abundance heatmap from (A). The left color bar represents the Spearman correlation coefficient of each OTU with the total cecal SCFAs concentrations. Hierarchical clustering based on the Spearman correlation coefficient was applied to order samples and OTUs. Significance was determined by the Adonis method (p < 0.05, ∗∗p < 0.01, ∗∗∗p < 0.001). Data are from one experiment and for (B) are representative of three independent experiments. Data in (B) were generated with R boxplot with the middle bar representing the median and whiskers showing 1.5× inter-quartile range (IQR). See also Figure S3.
Figure 5
Figure 5
Hpb Infection Fails to Attenuate Allergic Airway Inflammation in Ffar3−/− Mice C57BL/6 wild-type or Ffar3−/− SPF mice were infected or not with Hpb, then subjected to HDM sensitization and challenge. Mice were sacrificed 3 days after the final HDM challenge and the severity of airway inflammation determined. (A) Differential cell counts in the BALF. Abbreviations are as follows: Mac, macrophages; neut, neutrophils; eos, eosinophils; lymph, lymphocytes. (B) Percent eosinophils within BALF cells. (C and D) Concentrations of (C) IL-4 and (D) IL-5 cytokines within the BALF. (E) Measurement of HDM-specific IgG1 in the serum. Abbreviation is as follows: OD, optical density. (F) Mean gross lung histological pathology scores with representative pictures of H&E-stained lung tissue. Scale bars represent 1 mm. (G) Mean goblet cell index with representative pictures of periodic acid-Schiff-stained lung tissue. Scale bars represent 200 μm. Data are expressed mean ± SD (n = 5). Each symbol represents an individual mouse. Statistical significance was determined with two-way analysis of variance (ANOVA) or Student’s t test (E), p < 0.05, ∗∗p < 0.01, ∗∗∗p < 0.001. Data are from one experiment and are representative of three (A–E) or two (F and G) independent experiments. See also Figure S4.
Figure 6
Figure 6
Hpb Infection Modulates Anti-inflammatory Cytokine Production and Treg Cell Function in the Lungs of Allergic Mice in a GPR41-Dependent Manner SPF C57BL/6 wild-type or Ffar3−/− mice were infected or not with Hpb, then subjected to HDM sensitization and challenge. Mice were sacrificed 3 days after the final HDM challenge. (A and B) Concentrations of (A) IL-10 and (B) TGF-β cytokines in lung tissue homogenates. (C and D) Quantification of lung (C) and colon (D) Treg cells in WT and Ffar3−/− mice by flow cytometry analysis. (E and F) Treg cells were isolated from the lungs of naive or Hpb-infected WT and Ffar3−/− HDM-challenged mice and cultured together with naive responder T cells in the presence of anti-CD3 and anti-CD28. (E) Concentrations of IL-10 cytokine in the supernatant of wells containing a responder T cell:Treg cell ratio of 2:1. (F) Proliferation as assessed by Ki67 expression. Significances in red compare WT Hpb versus Ffar3−/− Hpb and significances in blue compare WT naive versus WT Hpb-infected HDM-challenged mice. Data are expressed as the mean ± SEM (n = 5). Statistical significance was determined with two-way analysis of variance (ANOVA); p < 0.05, ∗∗p < 0.01, ∗∗∗p < 0.001. Data in (A)–(D) are pooled from two independent experiments. Data in (E) and (F) are from one experiment and are representative of two independent experiments.
Figure 7
Figure 7
Helminth Infection Elevates the Concentration of SCFAs in Pigs and Humans (A and B) GC-MS quantification of (A) total SCFA concentrations and (B) acetate, propionate, and butyrate concentrations in cecal contents taken from naive and A. suum-infected pigs. (C) Total increases of SCFA concentrations of fecal samples from celiac patients before versus after hookworm (N. americanus) infection. Each symbol represents an individual patient (Pt). (D) Individual percent increases of SCFA concentrations of fecal samples from celiac patients before versus after N. americanus infection. Data are expressed as mean ± SD. Statistical significance was determined by Student’s t test, p < 0.05, ∗∗p < 0.01, ∗∗∗p < 0.001.

Comment in

References

    1. Arpaia N., Campbell C., Fan X., Dikiy S., van der Veeken J., deRoos P., Liu H., Cross J.R., Pfeffer K., Coffer P.J., Rudensky A.Y. Metabolites produced by commensal bacteria promote peripheral regulatory T-cell generation. Nature. 2013;504:451–455. - PMC - PubMed
    1. Broadhurst M.J., Ardeshir A., Kanwar B., Mirpuri J., Gundra U.M., Leung J.M., Wiens K.E., Vujkovic-Cvijin I., Kim C.C., Yarovinsky F. Therapeutic helminth infection of macaques with idiopathic chronic diarrhea alters the inflammatory signature and mucosal microbiota of the colon. PLoS Pathog. 2012;8:e1003000. - PMC - PubMed
    1. Cahenzli J., Köller Y., Wyss M., Geuking M.B., McCoy K.D. Intestinal microbial diversity during early-life colonization shapes long-term IgE levels. Cell Host Microbe. 2013;14:559–570. - PMC - PubMed
    1. Collison L.W., Vignali D.A. In vitro Treg suppression assays. Methods Mol. Biol. 2011;707:21–37. - PMC - PubMed
    1. Cooper P.J., Chico M.E., Rodrigues L.C., Ordonez M., Strachan D., Griffin G.E., Nutman T.B. Reduced risk of atopy among school-age children infected with geohelminth parasites in a rural area of the tropics. J. Allergy Clin. Immunol. 2003;111:995–1000. - PubMed

Publication types

MeSH terms