. 2015 Dec;47(12):1385-92.
doi: 10.1038/ng.3431. Epub 2015 Nov 2.

Contrasting genetic architectures of schizophrenia and other complex diseases using fast variance-components analysis

Collaborators, Affiliations

Contrasting genetic architectures of schizophrenia and other complex diseases using fast variance-components analysis

Po-Ru Loh et al. Nat Genet. 2015 Dec.

Abstract

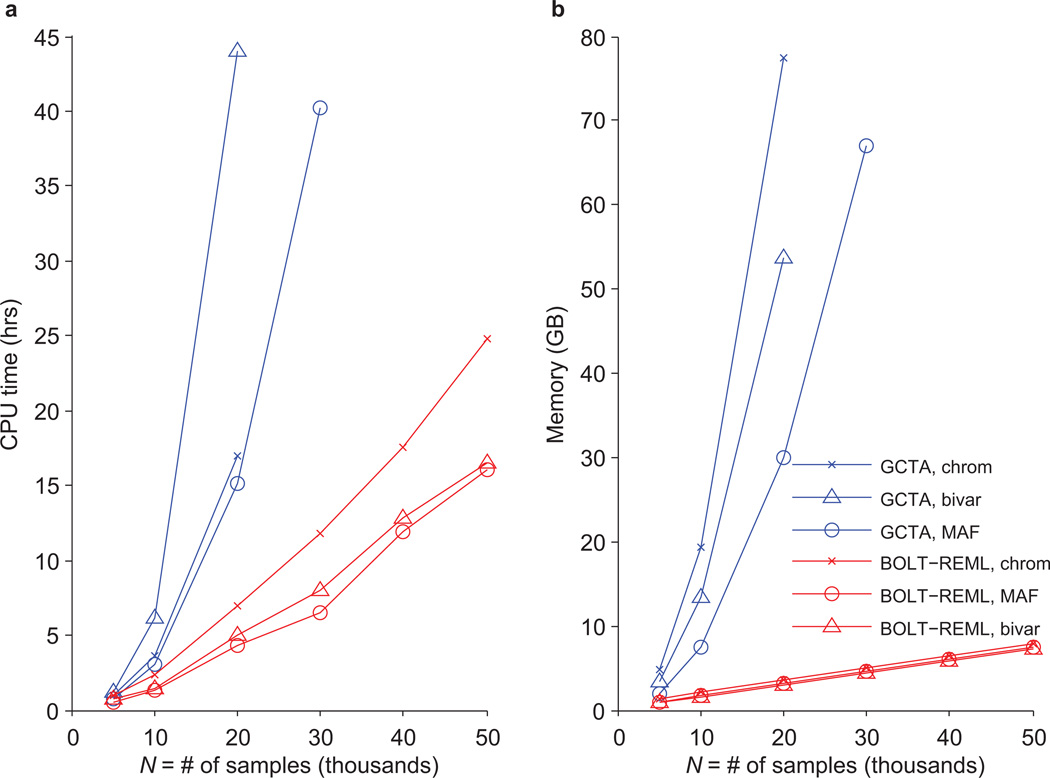
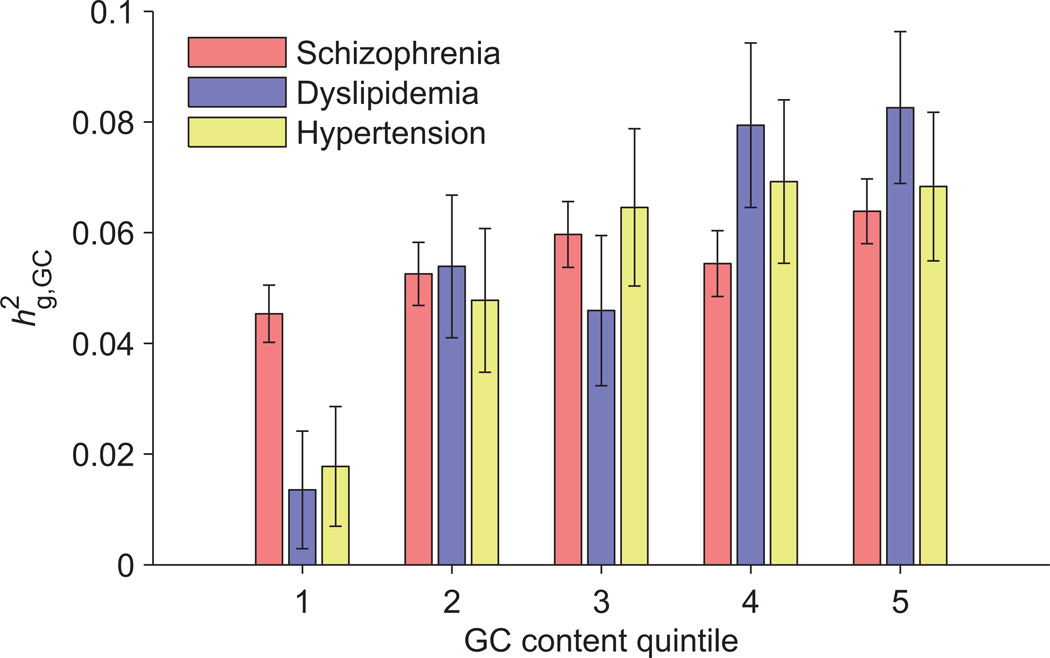
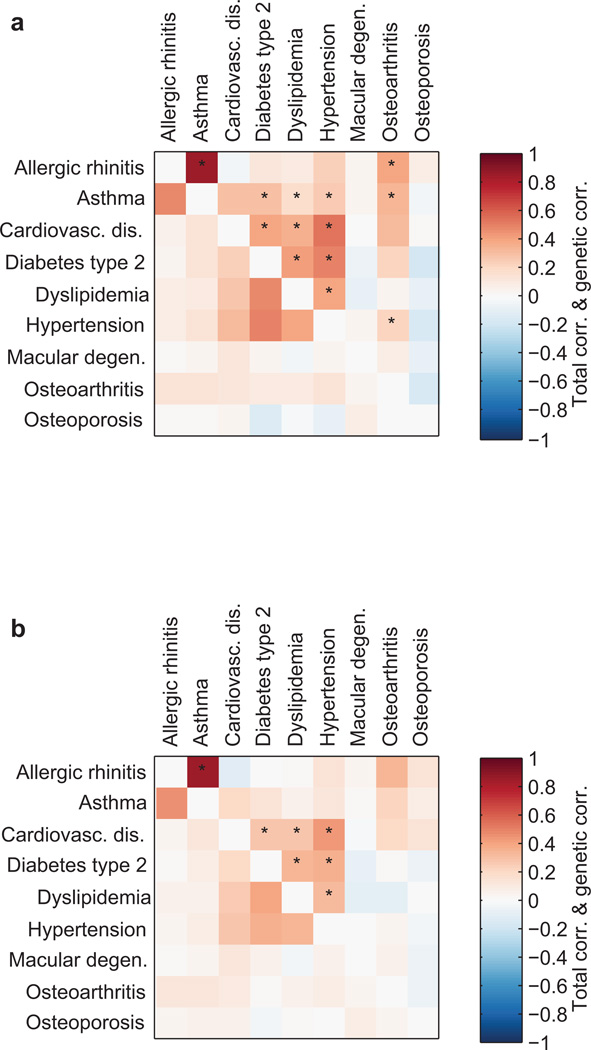
Heritability analyses of genome-wide association study (GWAS) cohorts have yielded important insights into complex disease architecture, and increasing sample sizes hold the promise of further discoveries. Here we analyze the genetic architectures of schizophrenia in 49,806 samples from the PGC and nine complex diseases in 54,734 samples from the GERA cohort. For schizophrenia, we infer an overwhelmingly polygenic disease architecture in which ≥71% of 1-Mb genomic regions harbor ≥1 variant influencing schizophrenia risk. We also observe significant enrichment of heritability in GC-rich regions and in higher-frequency SNPs for both schizophrenia and GERA diseases. In bivariate analyses, we observe significant genetic correlations (ranging from 0.18 to 0.85) for several pairs of GERA diseases; genetic correlations were on average 1.3 tunes stronger than the correlations of overall disease liabilities. To accomplish these analyses, we developed a fast algorithm for multicomponent, multi-trait variance-components analysis that overcomes prior computational barriers that made such analyses intractable at this scale.


Figures

Figure 1
Figure 1. Computational performance of BOLT-REML and GCTA heritability analysis algorithms
Benchmarks of BOLT-REML and GCTA in three heritability analysis scenarios: partitioning across 22 chromosomes, partitioning across six MAF bins, and bivariate analysis. Run times (a) and memory (b) are plotted for runs on subsets of the GERA cohort with fixed SNP count M=597,736 and increasing sample size (N) using dyslipidemia as the phenotype in the univariate analyses and hypertension as the second phenotype in the bivariate analysis. Reported run times are medians of five identical runs using one core of a 2.27 GHz Intel Xeon L5640 processor. Reported run times for GCTA are total times required for computing the GRM and performing REML analysis; time breakdowns and numeric data are provided in Supplementary Table 1. Data points not plotted for GCTA indicate scenarios in which GCTA required more memory than the 96GB available. Software versions: BOLT-REML, v2.1; GCTA, v1.24.
Figure 2
Figure 2. Extreme polygenicity of schizophrenia compared to other complex diseases
(a) Manhattan-style plots of estimated SNP-heritability per 1Mb region of the genome, hg,1Mb2, for dyslipidemia, hypertension, and schizophrenia. The APOE region of chromosome 19 is an outlier with an hg,1Mb2 estimate of 0.022. (b) Fractions of 1Mb regions with estimated hg,1Mb2 equal to its lower bound constraint of zero in disease phenotypes (solid) and simulated phenotypes with varying degrees of polygenicity and with hg2 matching the hgcc2 of each disease (dashed). Simulation data plotted are means over 5 simulations; error bars, 95% prediction intervals assuming Bernoulli sampling variance and taking into account s.e.m. (c) Conservative 95% confidence intervals for the cumulative fraction of SNP-heritability explained by the 1Mb regions that contain the most SNP-heritability. Lower bounds are from a cross-validation procedure involving only the disease phenotypes while upper bounds are inferred from the empirical sampling variance of hg,1Mb2 estimates (Online Methods).
Figure 3
Figure 3. SNP-heritability of disease liabilities partitioned by GC content
GC content was computed at 1Mb resolution, after which 1Mb regions were stratified into GC quintiles for variance components analysis. Quintiles 1–5 have median GC contents of 35.7%, 38.1%, 40.2%, 42.8%, and 47.2%, respectively. Error bars, 95% confiden-ce intervals based on REML analytic standard errors.
Figure 4
Figure 4. Inferred heritability of schizophrenia liability due to SNPs of various allele frequencies
(a) Simulated narrow-sense heritability per MAF bin (hMAF2, dashed blue curves) and estimated SNP-heritability per MAF bin (hg,MAF2, solid red curves) for quantitative phenotypes with genetic architectures in which SNPs of minor allele frequency p have average per-allele effect size variance proportional to p (1 − p)α. Simulations used causal SNPs with MAF≥0.1% in UK10K sequencing data and tag SNPs from our PGC2 analyses; error bars, 95% confidence intervals based on 4,000 runs. (b) SNP-heritability (red) and inferred narrow-sense heritability (blue) of schizophrenia liability partitioned across six MAF bins. Point estimates of narrow-sense heritability per bin are based on interpolated values of the ratio hg,MAF2hMAF2 at α=−0.28, which provided the best weighted least-squares fit between observed hg,MAF2 and interpolated hg,MAF2 from the simulations in panel (a) (Supplementary Fig. 12). (c) Inferred narrow-sense heritability of schizophrenia liability explained per SNP in each MAF bin, i.e., hMAF2 in panel (b) normalized by UK10K SNP counts (Supplementary Table 14). Schizophrenia hg,MAF2 error bars, 95% confidence intervals based on REML analytic standard errors. Schizophrenia hMAF2 and σMAF2 error bars, unions of 95% confidence intervals assuming −1≤α≤0.
Figure 5
Figure 5. Genetic correlations and total correlations of GERA disease liabilities
(a) Correlations from bivariate analyses using only age, sex, 10 principal components, and Affymetrix kit type as covariates. (b) Correlations from bivariate analyses including BMI as an additional covariate. Genetic correlations are above the diagonals; total liability correlations are below the diagonals. Asterisks indicate genetic correlations that are significantly positive (z>3) accounting for 36 trait pairs tested. Numeric data including standard errors are provided in Supplementary Table 15.

References

    1. Yang J, et al. Common SNPs explain a large proportion of the heritability for human height. Nature Genetics. 2010;42:565–569. - PMC - PubMed
    1. Yang J, Lee SH, Goddard ME, Visscher PM. GCTA: a tool for genome-wide complex trait analysis. American Journal of Human Genetics. 2011;88:76–82. - PMC - PubMed
    1. Lee SH, Wray NR, Goddard ME, Visscher PM. Estimating missing heritability for disease from genome-wide association studies. American Journal of Human Genetics. 2011;88:294–305. - PMC - PubMed
    1. Yang J, et al. Genome partitioning of genetic variation for complex traits using common SNPs. Nature Genetics. 2011;43:519–525. - PMC - PubMed
    1. Lee SH, et al. Estimating the proportion of variation in susceptibility to schizophrenia captured by common SNPs. Nature Genetics. 2012;44:247–250. - PMC - PubMed

References (Online Methods)

    1. Chen C-Y, et al. Improved ancestry inference using weights from external reference panels. Bioinformatics. 2013:btt144. - PMC - PubMed
    1. Manichaikul A, et al. Robust relationship inference in genome-wide association studies. Bioinformatics. 2010;26:2867–2873. - PMC - PubMed
    1. Manichaikul A, et al. Population structure of Hispanics in the United States: the multi-ethnic study of atherosclerosis. PLOS Genetics. 2012;8:e1002640. - PMC - PubMed
    1. Hoffmann TJ, et al. Next generation genome-wide association tool: Design and coverage of a high-throughput European-optimized SNP array. Genomics. 2011;98:79–89. - PMC - PubMed
    1. Chang CC, et al. Second-generation PLINK: rising to the challenge of larger and richer datasets. GigaScience. 2015 - PMC - PubMed

Publication types