. 2016 Jan;17(1):57-64.
doi: 10.1038/ni.3294. Epub 2015 Nov 2.

Group 2 innate lymphoid cells license dendritic cells to potentiate memory TH2 cell responses

Affiliations

Group 2 innate lymphoid cells license dendritic cells to potentiate memory TH2 cell responses

Timotheus Y F Halim et al. Nat Immunol. 2016 Jan.

Abstract

Rapid activation of memory CD4(+) T helper 2 (TH2) cells during allergic inflammation requires their recruitment into the affected tissue. Here we demonstrate that group 2 innate lymphoid (ILC2) cells have a crucial role in memory TH2 cell responses, with targeted depletion of ILC2 cells profoundly impairing TH2 cell localization to the lungs and skin of sensitized mice after allergen re-challenge. ILC2-derived interleukin 13 (IL-13) is critical for eliciting production of the TH2 cell-attracting chemokine CCL17 by IRF4(+)CD11b(+)CD103(-) dendritic cells (DCs). Consequently, the sentinel function of DCs is contingent on ILC2 cells for the generation of an efficient memory TH2 cell response. These results elucidate a key innate mechanism in the regulation of the immune memory response to allergens.


Figures

Fig. 1
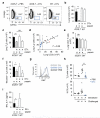
Fig. 1. Protease allergen induces a robust memory TH2 cell-mediated recall response in sensitized mice
(a–d) Mice were sensitized and re-challenged with papain + 2W1S-peptide as indicated (a) followed by analysis every 2 days for: broncho-alveolar lavage (BAL) eosinophils, neutrophils or alveolar macrophages (MΦ) as described in Supplementary Fig. 1a (b). Lung ILC2 (Live CD45+CD3εCD4 LineageGATA3+) and 2W1S-tetramer+/− TH2 cells (Live CD45+CD3ε+CD4+ Foxp3GATA3+) were detected by flow cytometry (c), and quantified (d). (e) Sensitized mice were re-challenged on day 132, and total lung eosinophils were measured on day 135. (f–g) Papain + 2W1S sensitized mice were re-challenged with 2W1S + papain (PAP) or heat-inactivated papain (HP) on day 15, followed by an analysis of lung eosinophils (e) or CCL17 levels in the BAL (f) on day 16. Data are representative of at least two independent experiments per group, each containing at least three animals. Individual points indicate individual animals in (e). Mean values ± SEM are indicated in b, d–g. p ≤ 0.001 = *, p ≤ 0.0001 = **.
Fig. 2
Fig. 2. ILC2 are required for memory TH2 cell response to allergens
(a–e) Wildtype (WT) or ILC2-depleted iCOS-T mice were sensitized, re-challenged, and treated with DTx as indicated (Supplementary Fig. 4a). Lung ILC2s were detected by flow cytometry as in Fig. 1c (a) and quantified (b). Total lung TH2 cells in ILC2 non-depleted (black), depleted (gray), or WT control mice on day 16 were detected as in Fig. 1c and calculated (c). Total ILC2s and TH2 cells in the lungs of iCOS-T mice treated with PBS (black) or DTx (blue) on day 16 were quantified and plotted (d). Two iCOS-T mice failed ILC2-depletion (red), as indicated by increased ILC2 numbers over the threshold of average naive lung ILC2s (dotted line). Total numbers of lung CD4+ T cells were quantified (e). (f–g) WT or iCOS-T mice were treated as indicated (Supplementary Fig. 4b) and total numbers of tetramer+ TH2 cells in the lungs were quantified (f). Intracellular Ki67 expression was measured in lung CD4+ T cell populations (g). (h) Sensitized iCOS-T mice were re-challenged on day 132 as indicated, followed by quantification of lung ILC2 and TH2 cells on day 135. PBS (black) or DTx (blue) was administered (Supplementary Fig. 4e). (i) BAL IL-4 concentrations were measured on day 16 in WT or iCOS-T animals treated as indicated (Supplementary Fig. 4a). Data are representative of at least two independent experiments per group, each containing at least three animals, and one experiment containing 3–6 animals (h). Individual points indicate individual animals in d and h. Mean values ± SEM are indicated in b, c, e, f, h, and i, Pearson’s test was performed in (d). ns = not significant, p ≤ 0.05 = *, p ≤ 0.01 = **.
Fig. 3
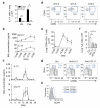
Fig. 3. ILC2 activation occurs early after allergen challenge, and precedes IL-13 and CCL17-mediated recruitment of memory TH2 cells
(a) Sensitized mice (Fig. 1a) were analyzed before challenge (Ctrl) or 6 hours after re-challenge (Pap). IL-13+ lung ILC2s and TH2 cells (identified similar to Fig. 1c) were quantified. (b–c) Sensitized mice (Fig. 1a) were analyzed for IL-13 and CCL17 levels in the BAL immediately after re-challenge (b), or over 28 days (c). (d–e). Lung CD44hiCD62LCD4+ T cells were gated and analyzed for the CCR4+ percentage (d) and total numbers of CCR4+CD44hiCD62LCD4+ T cells (e). (f–h) Sensitized mice were treated with neutralizing antibodies prior to challenge (Supplementary Fig. 4e). Total lung TH2 cells (identified similar to Fig. 1c) were quantified on day 16 (f). The percentage of lung CD44hiCD62Llo (blue) among total gated CD4+ T cells was identified (g). CCR4 expression was analyzed on lung CD4+ T cell populations in control treated mice (h). Data are representative of at least two independent experiments per group or at least three animals. Mean values ± SEM are indicated in a–c, e–g. p ≤ 0.05 =*, p ≤ 0.01 = **.
Fig. 4
Fig. 4. CCL17+CD103CD11b+ DCs expand after antigen challenge
(a–b) Mice were treated on days 0 and 1 with papain followed by analysis on day 2 for intracellular CCL17 in lung B220CD11c+MHCII+ DCs (a). CD11b+CD103 (blue) and CD11b CD103+ (red) CCL17+ DC populations were analyzed for IRF4 expression and quantified (b). (c) Microarray datasets from CD11bCD103+ (CD11b) and CD11b+CD103 (CD11b+) lung CD11c+MHCIIhi DCs, Siglec-FCD11b+ and Siglec-F+CD11b (Alveolar) CD11c+MHCIIintSSChi lung macrophages, CD3B220MHCIILy-6c+CD115+ monocytes, and activated and naive lung ILC2s were analyzed for relative gene expression. Data are representative of at least two independent experiments per group, containing at least three animals or cultures. Mean values ± SEM are indicated in b.
Fig. 5
Fig. 5. ILC2s and IL-13 are critical for CCL17+ DC proliferation and CCL17 production after allergen exposure
(a) IL-13Rα1 expression was measured by flow cytometry on Siglec-F+CD11c+F4/80+ lung macrophages, B220MHCIIhiCD11c+CD11b and CD11b+ DCs. Gray shaded area indicates Fluorescence minus one (FMO) staining control, black line indicates IL13ra1−/− animals and blue line indicates WT animals. (b–c) WT, WT + anti-IL-13 or transgenic mice were treated with papain or heat-inactivated papain (HP) on days 0 and 1, followed by analysis of BAL CCL17 concentrations (b) or CCL17+CD11b+CD103 DCs (c) on day 2. Groups were compared to WT treated with papain (PAP). (d) CCL17+ DC populations were quantified in the lungs of naive (Ctrl) or papain-treated (PAP) WT BMT and Rorasg/sg BMT mice on day 2. (e–f) CCL17+CD11b+CD103 DCs were quantified in the lungs (e) and CCL17 concentrations were measured in the BAL (f) of WT and iCOS-T mice treated as indicated (Supplementary Fig. 4a). (g) Co-culture supernatants of antigen-experienced OTII-transgenic CD44+CD4+ T cells, plus WT DCs and/or ILC2s were analyzed for CCL17. Data are representative of at least two independent experiments per group, containing at least three animals or cultures. Individual points indicate individual animals in (c). Mean values ± SEM are indicated in b–g. p ≤ 0.05 =*, p ≤ 0.01 = **, p ≤ 0.001 = ***, p ≤ 0.0001 = ****.
Fig. 6
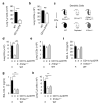
Fig. 6. IL-13 is critical for DC-mediated memory TH2 cell recruitment after antigen-re-challenge
(a–b) CD11c-DTR mice were treated as indicated (Supplementary Fig. 6a), followed by the quantification of lung TH2 cells (a) or ILC2s (b) using staining similar to Fig. 1c. (c–h) Bone marrow-chimeric mice were sensitized and challenged as described (Supplementary Fig. 6f, g) and selectively depleted of CD11c-LuciDTR DCs (c). The number of DCs (d), ILC2s (e) or TH2 cells (h) in lung tissue was quantified following re-challenge. Concentrations of IL-13 (f) and CCL17 (g) in the BAL were measured. Data are representative of at least two independent experiments per group, containing at least three animals (a–b), or at least five animals per group (c–h). Mean values ± SEM are indicated in a–b and d–h. ns = not significant, p ≤ 0.05 =*, p ≤ 0.01 = **, p ≤ 0.001 = ***.
Fig. 7
Fig. 7. ILC2 are important for skin and peritoneal CCL17+ DC expansion and memory TH2 cell recruitment to the skin
(a) Naive mouse live CD45+B220CD11c+MHCII+ DCs were analyzed for CCL17, CD11b, CD103 and IRF4 expression in the lung and skin. IRF4 expression of colored-matched gated populations is indicated in the histogram. (b) WT, Il13−/− or Rora−/flIl7ra-Cre mice were injected intradermally into the ear with 10 μg of papain or HP (WT mice) on days 0 and 1, followed by quantification of CCL17+ DCs per ear on day 2. (c–d) Nippostrongylus brasiliensis (N.b.) infected or uninfected (Ctrl) WT mice were analyzed on day 6 post infection for CCL17 expression in peritoneal live CD45+B220CD11c+MHCII+ DCs as indicated. CCL17+ DCs were subsequently analyzed for CD11b, CD103 and IRF4 expression; the gray histogram depicts the FMO control for IRF4 staining (c). The total number of peritoneal CCL17+CD11b+CD103 DCs was quantified (d). (e) IL-13 or PBS (Ctrl) was injected intraperitoneally on day 0 in WT mice followed by quantification of peritoneal CCL17+CD11b+CD103 DCs on day 1. (f) IL-33 was administered intraperitoneally to WT and Rora−/flIl7ra-Cre mice, or PBS to WT mice (Ctrl) on day 0, followed by quantification of peritoneal CCL17+CD11b+CD103 DCs on day 1. (g) WT or iCOS-T mice were sensitized intranasally on days 0 and 1 with papain (10 μg), followed by intradermal re-challenge on day 15. (h) iCOS-T mice, treated as in g, were administered with DTx (blue) or PBS (black), followed by quantification of ILC2 (Live CD45+lineageCD127+GATA3+) and TH2 cells (Live CD45+ CD3+CD4+Foxp3GATA3+) in the right ear on day 16. (i) iCOS-T and WT mice were sensitized as in g, and treated with DTx and re-challenged intradermally as indicated. The total number of TH2 cells was quantified in the right ears. Data are representative of at least two independent experiments per group, containing at least three animals. Individual points indicate individual animals in (h). Mean values ± SEM are indicated in b, d–f and i, Pearson’s test was performed in (h). p ≤ 0.05 =*, p ≤ 0.01 = **, p ≤ 0.001 = ***.

Comment in

References

    1. Kim HY, DeKruyff RH, Umetsu DT. The many paths to asthma: phenotype shaped by innate and adaptive immunity. Nat Immunol. 2010;11(7):577–584. - PMC - PubMed
    1. Lambrecht BN, Hammad H. The immunology of asthma. Nat Immunol. 2014;16(1):45–56. - PubMed
    1. Islam SA, Luster AD. T cell homing to epithelial barriers in allergic disease. Nat Med. 2012;18(5):705–715. - PMC - PubMed
    1. McKenzie AN, Spits H, Eberl G. Innate lymphoid cells in inflammation and immunity. Immunity. 2014;41(3):366–374. - PubMed
    1. Moro K, Yamada T, Tanabe M, Takeuchi T, Ikawa T, Kawamoto H, et al. Innate production of T(H)2 cytokines by adipose tissue-associated c-Kit(+)Sca-1(+) lymphoid cells. Nature. 2010;463(7280):540–544. - PubMed

Publication types