. 2015 Dec;21(12):1445-54.
doi: 10.1038/nm.3982. Epub 2015 Nov 2.

An AKT3-FOXG1-reelin network underlies defective migration in human focal malformations of cortical development

Affiliations

An AKT3-FOXG1-reelin network underlies defective migration in human focal malformations of cortical development

Seung Tae Baek et al. Nat Med. 2015 Dec.

Abstract

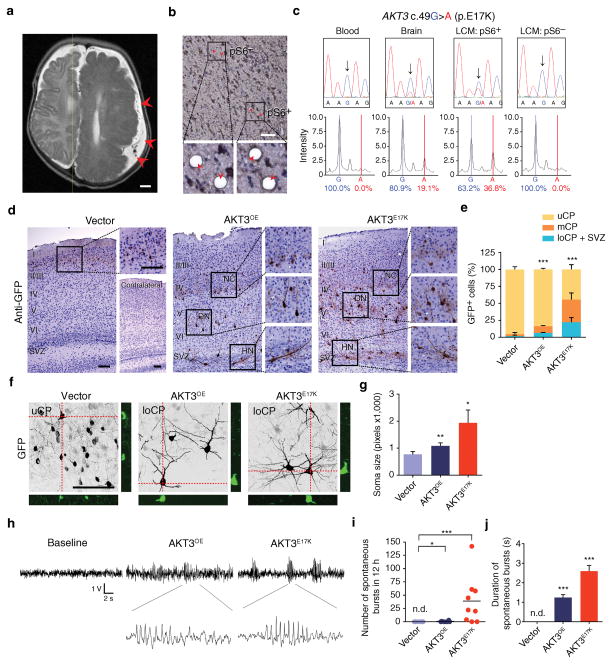
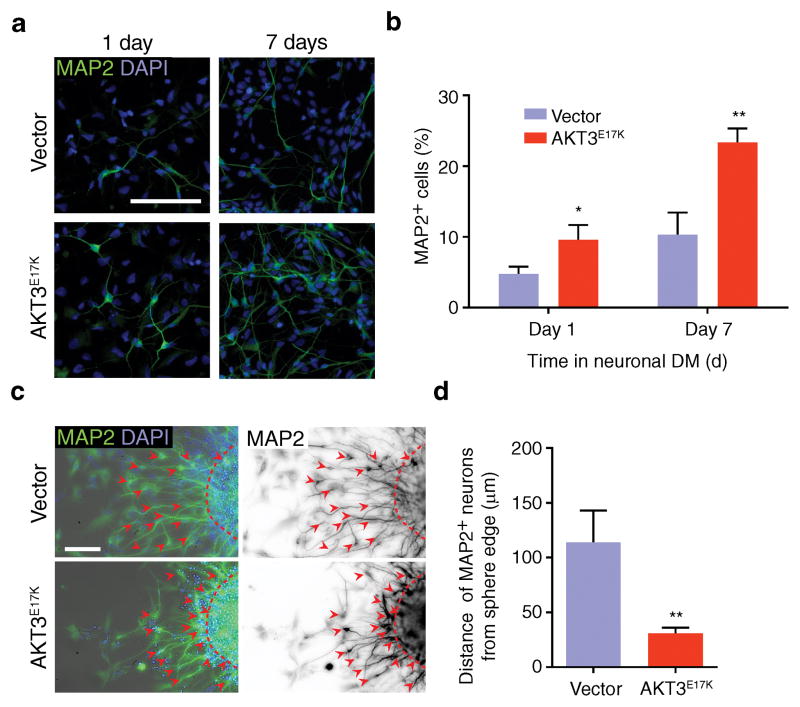
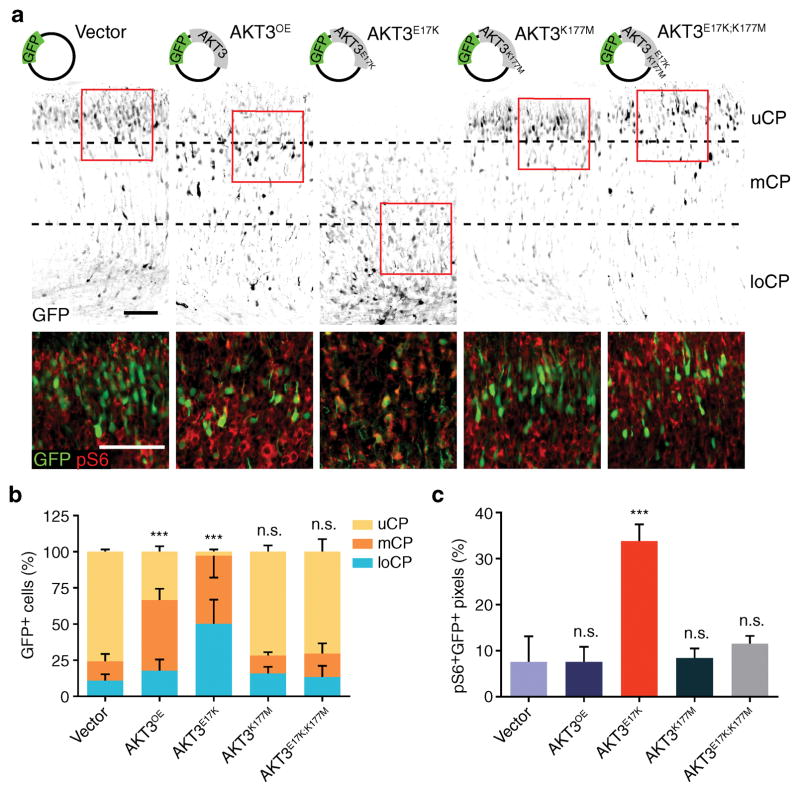
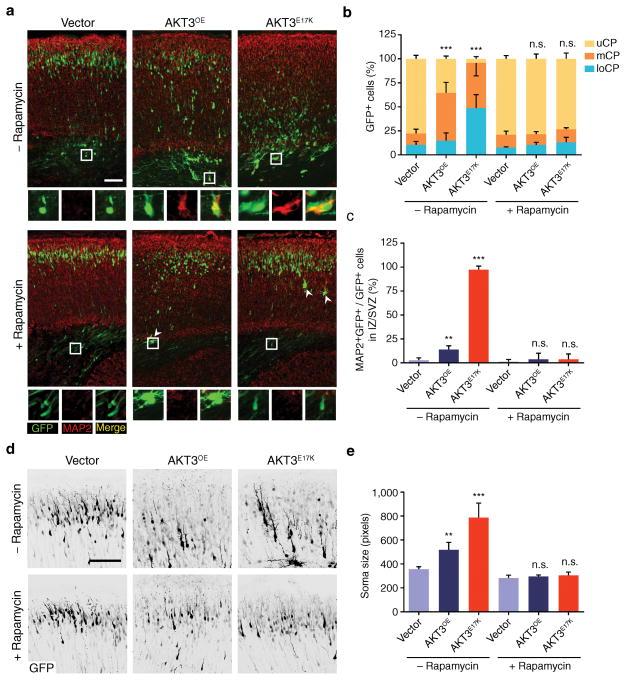
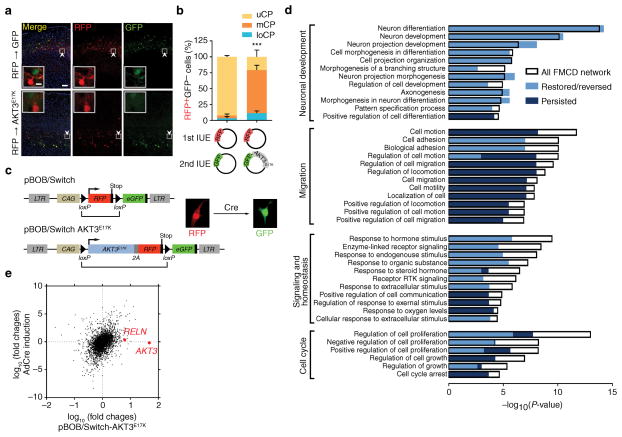
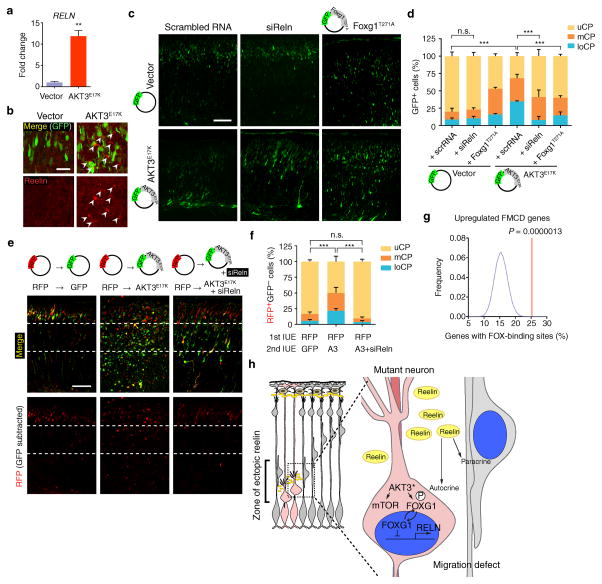
Focal malformations of cortical development (FMCDs) account for the majority of drug-resistant pediatric epilepsy. Postzygotic somatic mutations activating the phosphatidylinositol-4,5-bisphosphate-3-kinase (PI3K)-protein kinase B (AKT)-mammalian target of rapamycin (mTOR) pathway are found in a wide range of brain diseases, including FMCDs. It remains unclear how a mutation in a small fraction of cells disrupts the architecture of the entire hemisphere. Within human FMCD-affected brain, we found that cells showing activation of the PI3K-AKT-mTOR pathway were enriched for the AKT3(E17K) mutation. Introducing the FMCD-causing mutation into mouse brain resulted in electrographic seizures and impaired hemispheric architecture. Mutation-expressing neural progenitors showed misexpression of reelin, which led to a non-cell autonomous migration defect in neighboring cells, due at least in part to derepression of reelin transcription in a manner dependent on the forkhead box (FOX) transcription factor FOXG1. Treatments aimed at either blocking downstream AKT signaling or inactivating reelin restored migration. These findings suggest a central AKT-FOXG1-reelin signaling pathway in FMCD and support pathway inhibitors as potential treatments or therapies for some forms of focal epilepsy.


Figures

Figure 1
Figure 1. Modeling FMCD mutation in developing brain
(a) Representative presurgical axial T2 MRI of subject with hemimegalencephaly (previously reported in ref 1) with FMCD due to somatic mosaic AKT3 p.E17K mutation with dysorganization across the entire hemisphere (arrowheads), compared with healthy contralateral hemisphere. (b) Representative images of brain section with somatic mosaic AKT3 c.49G>A (p.E17K) mutation showing laser-captured microdissection (LCM) of pS6+ or pS6 cells. Postcapture of indicated cells (arrowheads) below. (c) Total DNA from blood or brain tissue and microdissected nuclei analyzed by capillary (Sanger) sequencing (top) and mass spectrometry (bottom). Arrows AKT3 c.49G>A. (d–g) Immunostained (GFP) images of mouse brain sections at postnatal day 20 (d), in utero electroporated at E14.5 with GFP-alone vector (n = 4) or GFP along with AKT3 wildtype (AKT3OE, n = 5) or AKT3 p.E17K (AKT3E17K, n = 5) expression vectors. Insets: neuronal crowding (NC), dysmorphic neurons (DN) and heterotopic neurons (HN). Contralateral side showed no structural defect. Localization of GFP+ cells quantified in upper (uCP, layer I–IV); middle (mCP, layer V), lower cortical plate (loCP, layer VI)-subventricular zone (SVZ) (e). Confocal z-stack images of P20 25 μm sections, showing orthogonal views (f) for quantification of cell size (g). (h–j) Representative surface EEG recordings from 1 month-old mice (h). Number (i) and duration (j) of spontaneous electroencephalographic bursts in 12 h window (n = 4, 6 and 9 for each condition). Values: mean ± s.d. *, P < 0.05; **, P < 0.01; ***, P < 0.001. n.d., not detected, G-test of goodness-of-fit (e); Student’s t-test (g, i, j). Scale bars: 1 cm (a); 100 μm (b, d, f).
Figure 2
Figure 2. Cellular pathology from AKT3 activation in human neural progenitor cells
(a) Neural differentiation assayed by MAP2 staining (green) in human neural progenitor cells (hNPCs) expressing GFP-alone vector or AKT3E17K at 1 and 7 days in differentiation media (DM), quantified (b) (n = 5 cultures for both). (c) Neuronal migration of FAC-sorted lentiviral transduced hNPCs expressing GFP-alone vector or AKT3E17K in neurosphere assays. MAP2 (green) and DAPI (blue) on left used to define the edge of the neurosphere; MAP2 (black) on right used to measure migration distance. Dashed lines: boundary of neurosphere; arrowheads: cell body position. (d) Migration was quantified by measuring the distance of MAP2+ cells from the neurosphere boundary (n = 15 neurospheres from 5 cultures for both). Values: mean ± s.d. *, P < 0.05; **, P < 0.01, Student’s t-test (b, d). Scale bars: 100 μm.
Figure 3
Figure 3. AKT3 kinase activity is essential for aberrant migration phenotype
(a) In utero electroporation at E14.5 of GFP vector encoding AKT3 variants, harvested at E18.5. Images were inverted for visibility, co-stained with phospho-S6 (pS6) of boxed regions below, enhanced contrast for visibility. (b) Localization of GFP+ cells quantified in upper (uCP); middle (mCP), and lower cortical plate (loCP). (c) Quantification of pS6+GFP+ pixels for the images described in (a). Values: mean ± s.d. (n = 3, 3, 6, 5 and 5 for each condition). n.s., not significant; ***, P < 0.001, G-test of goodness-of-fit (b); Student’s t-test (c). Scale bars: 100 μm.
Figure 4
Figure 4. Pharmacological rescue of AKT3E17K-induced phenotypes
(a) In utero electroporation at E14.5 followed by daily administration of rapamycin (3 μg/gram-body-weight/day), visualized at E18.5. MAP2 positivity of electroporated cells in lower cortex (insets). Arrowheads: rare giant neurons in rapamycin-treated embryos. (b, c) Quantified localization of GFP+ cells in upper (uCP); middle (mCP), and lower cortical plate (loCP), and MAP2+GFP+ cells in intermediate zone (IZ)/subventricular zone (SVZ). (d) Representative images used to calculate soma size of neurons from mice electroporated with GFP-alone, AKTOE, or AKTE17K expression construct, with or without rapamycin treatment. Tissue for analysis was harvested at E18.5. GFP immunofluorescence is shown in black. (e) Quantification of neuronal soma size for the groups described in (d). Values: mean ± s.d. (n = 3, 3, 3, 5, 3, 5). **, P < 0.01; ***, P < 0.001, G-test of goodness-of-fit (b); Student’s t-test (c, e). Scale bars: 100 μm.
Figure 5
Figure 5. Genetic recombination of AKT3E17K defines reversibility of FMCD networks
(a) In utero electroporation at E14.5 of RFP vector, followed by second electroporation after 15 min of GFP-alone (n = 5) or GFP along with AKT3E17K (n = 3) harvested at P14. Insets: singularity of plasmid expression. (b) Quantified localization of RFP+GFP cells. (c) pBOB/Switch vectors, empty (top) or with AKT3E17K linked (bottom). RFP expressed from a bicistronic 2A sequence, allowing stoichiometric RFP and AKT3E17K expression. LTR, long terminal repeat; CAG, chicken actin promoter. RFP-expression cassette with stop codon is removed upon Cre recombination with adenoviral transduction (bracket), providing color switch from RFP to GFP. (d) GO analysis identified four major enriched categories (Neuronal development, Migration, Signaling and homeostasis, and Cell cycle), and several subcategories as indicated. P-values for GO enrichment for each subcategory are shown (x-axis). Colors indicate P-values of the GO enrichment for the portion of the genes within each subcategory that persisted (dark blue), or were restored (from high to background or from low to background, light blue) or reversed (from high to low or from low to high, light blue), overlaid on each subcategory. (e) Comparison of mRNA abundance after AKT3E17K overexpression (x-axis) vs. genetic removal of AKT3E17K by Cre recombination (y-axis). Note that the expression of AKT3 and RELN were initially elevated with AKT3E17K overexpression but were restored upon Cre recombination. Values: mean ± s.d. ***, P < 0.001, G-test of goodness-of-fit (b); Scale bars: 100 μm (a); 10 μm (inset in a).
Figure 6
Figure 6. Neuronal migration defects rescued by Reln siRNA
(a) Quantitative real-time PCR was performed to measure RELN expression in hNPCs expressing AKT3E17K and compared to vector-expressing hNPCs. Three independent experiments were quantified in triplicate. (b) Mouse embryos at E14.5 were electroporated with indicated DNA constructs. Brains isolated at E18.5 used for reelin expression. Arrowheads: reelin immunostaining in pericellular area of ectopic neurons (intensity-per-pixel: 622.55 ± 45.80 compared to 4092.77 ± 9.46, marginal zone). (c) E14.5 embryos were co-electroporated with indicated constructs or RNAs. (d) Localization of GFP+ neurons at E18.5 was quantified in each cortical region (n = 3 for each). (e, f) Developing cortices were in utero electroporated (IUE) at E14.5 with RFP vector. After 15 min, embryos were sequentially electroporated with either GFP vector (n = 3) or GFP also expressing AKT3E17K (A3) with or without Reln siRNA (n = 6 and 4, respectively). At E18.5, brains were sectioned for imaging. Localization of RFP+GFP cells was quantified in each cortical region. Values: mean ± s.d. n.s., not significant; **, P < 0.01; ***, P < 0.001, Student’s t-test (a); G-test of goodness-of-fit (d, f). Scale bars: 25 μm (b); 100 μm (c, e). (g) Enrichment of FOX-binding site. See Online Methods for details. (h) Model of effect of AKT3 mutation on surrounding cells. Mutant cell, pink; surrounding cells, gray. AKT3* activating somatic mutation leads to mTOR activation and phosphorylation and cytoplasmic sequestration of FOXG1, relieving repression of RELN, which is then secreted by mutant cells to act in an autocrine (cell autonomous) and paracrine (non-cell autonomous) fashion.

References

    1. Lee JH, et al. De novo somatic mutations in components of the PI3K-AKT3-mTOR pathway cause hemimegalencephaly. Nat Genet. 2012;44:941–945. - PMC - PubMed
    1. Poduri A, Evrony GD, Cai X, Walsh CA. Somatic mutation, genomic variation, and neurological disease. Science. 2013;341:1237758. - PMC - PubMed
    1. Aronica E, Becker AJ, Spreafico R. Malformations of cortical development. Brain Pathol. 2012;22:380–401. - PMC - PubMed
    1. Blumcke I, et al. The clinicopathologic spectrum of focal cortical dysplasias: a consensus classification proposed by an ad hoc Task Force of the ILAE Diagnostic Methods Commission. Epilepsia. 2011;52:158–174. - PMC - PubMed
    1. Taylor DC, Falconer MA, Bruton CJ, Corsellis JA. Focal dysplasia of the cerebral cortex in epilepsy. J Neurol Neurosurg Psychiatry. 1971;34:369–387. - PMC - PubMed

Publication types

MeSH terms

Associated data