

Measuring breath acetone for monitoring fat loss: Review
- PMID: 26524104
- PMCID: PMC4737348
- DOI: 10.1002/oby.21242
Measuring breath acetone for monitoring fat loss: Review
Abstract
Objective: Endogenous acetone production is a by-product of the fat metabolism process. Because of its small size, acetone appears in exhaled breath. Historically, endogenous acetone has been measured in exhaled breath to monitor ketosis in healthy and diabetic subjects. Recently, breath acetone concentration (BrAce) has been shown to correlate with the rate of fat loss in healthy individuals. In this review, the measurement of breath acetone in healthy subjects is evaluated for its utility in predicting fat loss and its sensitivity to changes in physiologic parameters.
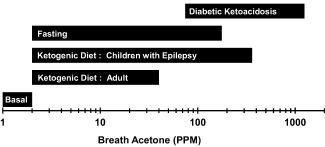
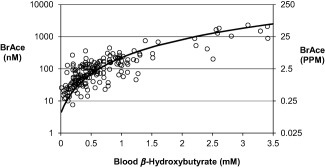
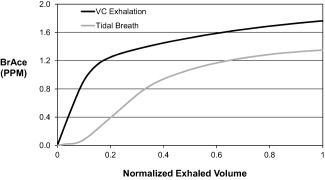
Results: BrAce can range from 1 ppm in healthy non-dieting subjects to 1,250 ppm in diabetic ketoacidosis. A strong correlation exists between increased BrAce and the rate of fat loss. Multiple metabolic and respiratory factors affect the measurement of BrAce. BrAce is most affected by changes in the following factors (in descending order): dietary macronutrient composition, caloric restriction, exercise, pulmonary factors, and other assorted factors that increase fat metabolism or inhibit acetone metabolism. Pulmonary factors affecting acetone exchange in the lung should be controlled to optimize the breath sample for measurement.
Conclusions: When biologic factors are controlled, BrAce measurement provides a non-invasive tool for monitoring the rate of fat loss in healthy subjects.
© 2015 The Authors Obesity published by Wiley Periodicals, Inc. on behalf of The Obesity Society (TOS).
Figures
References
-
- Freund G. The calorie deficiency hypothesis of ketogenesis tested in man. Metabolism 1965;14:985–990. - PubMed
-
- Freund G, Weinsier RL. Standardized ketosis in man following medium chain triglyceride ingestion. Metabolism 1966;15:980–991. - PubMed
-
- Passmore R. On ketosis. Lancet 1961;1:839–843. - PubMed
-
- Rooth G, Ostenson S. Acetone in alveolar air, and the control of diabetes. Lancet 1966;2:1102–1105. - PubMed
-
- Tassopoulos CN, Barnett D, Fraser TR. Breath‐acetone and blood‐sugar measurements in diabetes. Lancet 1969;1:1282–1286. - PubMed
Publication types
MeSH terms
Substances
LinkOut - more resources
Full Text Sources
Other Literature Sources
Medical
