. 2015 Dec;12(12):1163-70.
doi: 10.1038/nmeth.3651. Epub 2015 Nov 2.

Protein-RNA networks revealed through covalent RNA marks

Affiliations

Protein-RNA networks revealed through covalent RNA marks

Christopher P Lapointe et al. Nat Methods. 2015 Dec.

Abstract

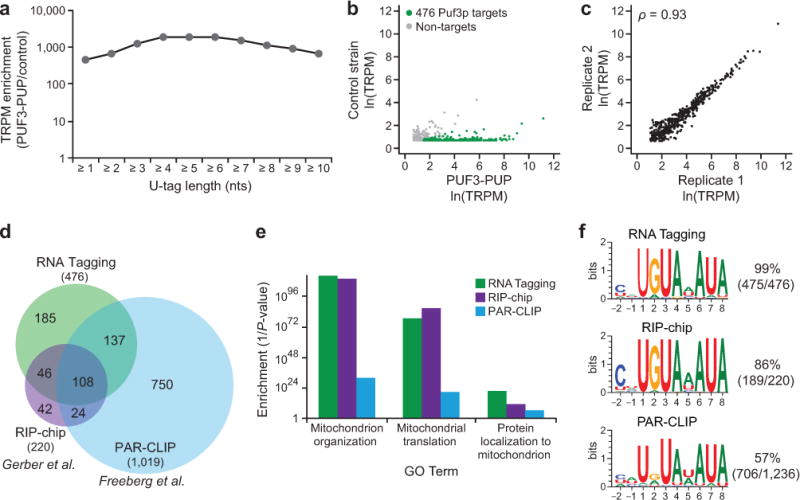
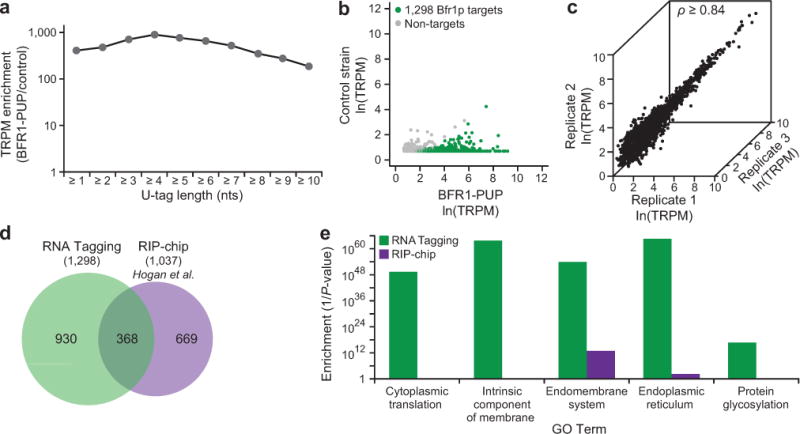
Protein-RNA networks are ubiquitous and central in biological control. We present an approach termed RNA Tagging that enables the user to identify protein-RNA interactions in vivo by analyzing purified cellular RNA, without protein purification or cross-linking. An RNA-binding protein of interest is fused to an enzyme that adds uridines to the end of RNA. RNA targets bound by the chimeric protein in vivo are covalently marked with uridines and subsequently identified from extracted RNA via high-throughput sequencing. We used this approach to identify hundreds of RNAs bound by a Saccharomyces cerevisiae PUF protein, Puf3p. The results showed that although RNA-binding proteins productively bind specific RNAs to control their function, they also 'sample' RNAs without exerting a regulatory effect. We used the method to uncover hundreds of new and likely regulated targets for a protein without canonical RNA-binding domains, Bfr1p. RNA Tagging is well suited to detect and analyze protein-RNA networks in vivo.


Conflict of interest statement

COMPETING FINANCIAL INTERESTS

The authors declare competing financial interests. C.P.L. and M.W. have filed a patent that encompasses the RNA Tagging approach.

Figures

Figure 1
Figure 1
The RNA Tagging approach. a) Strategy. RBP, RNA-binding protein. PUP, poly(U) polymerase. b) Schematic of targeted RT-PCR and transcriptome-wide RNA Tagging assays. RNAs are tailed with a combination of guanosines (G) and inosines (I) (purple). The U-select primer contained the Illumina 3′ adapter sequence (brown), nine cytosines (purple) that base pair with the G/I tail, and three adenosines (red) that select for uridines at the 3′ end of the mRNA. c) Computational identification of Tagged RNAs. A-tails refers to the poly(A) tail and U-tails refers to 3′ terminal uridines, which were often in the U-tag. d) Nature of the data. The cartoon depicts Tagged RNAs aligned to a representative gene. ORF, open reading frame. e) Plot of the mean U-tag length detected by high-throughput sequencing of synthetic DNA libraries that contained U-tags of 0, 2, 4, 6, 8, 10, and 12 nucleotides. At least 50,000 reads were detected for each library (>1 million total reads). The R2 value (R2 = 0.99, n = 7) was determined by linear regression analysis, and error bars represent standard deviation.
Figure 2
Figure 2
RNA Tagging identified transcriptome-wide Puf3p targets. a) Enrichment of Tagged RNAs detected across different U-tag lengths in PUF3-PUP yeast relative to a control yeast strain (BY4742). Enrichment was calculated as a ratio of TRPMs obtained in strains with and without the PUF3-PUP chimera. TRPM, Tagged RNAs per million uniquely mapped reads. b) Scatter plot of Tagged RNAs detected in the PUF3-PUP strain relative to the control strain (BY4742). Puf3p target mRNAs (see Online Methods) are colored green; non-targets are grey. c) Plot of the number of Tagged RNAs detected for the 476 Puf3p targets in two biological replicates. Spearman’s correlation coefficient (ρ) is indicated (ρ = 0.93, P = 0, n = 476). d) Proportional Venn diagram depicting the overlap between Puf3p targets identified by RNA Tagging versus those identified by other approaches,. e) Plot of selected Go Term enrichments (1/P-value) of Puf3p targets identified by RNA Tagging, RIP-chip, and PAR-CLIP. For simplicity, only 3 biological process terms are shown (see 1 for complete lists). f) Enriched sequence motifs, determined by MEME, in the 3′ UTRs Supplementary Data of Puf3p targets identified by RNA Tagging and RIP-chip, and in the PAR-CLIP peaks. The numbers indicate the fraction of 3′ UTRs in each set that contributed to the motif.
Figure 3
Figure 3
Puf3p target classes correlated with in vitro binding affinity and in vivo regulation. a) Heat map of clustered Puf3p targets, with Classes A (92 targets), B (189), and C (195) indicated. Each row in the heat map is an individual Puf3p target, and the colors indicate the number of TRPM detected with U-tags of at least the indicated number of uridines (columns). The highest ranked target is at the top of the heat map, and the lowest ranked target is at the bottom. The binding elements enriched in each of the Puf3p target classes are indicated. TRPM, Tagged RNAs per million uniquely mapped reads. PBE, Puf3p-binding element. b) Plot of the median rank of Puf3p targets that contain six distinct binding elements relative to the published in vitro binding affinity (Kd) of purified Puf3p for the same sequences. Pearson’s (r) and Spearman’s (ρ) correlation coefficients and associated P-values (P) are indicated (r = 0.98, P = 0.0009; ρ = 0.94, P = 0.0048; n = 6). c) Enrichment of Puf3p target classes for mRNAs and proteins localized to mitochondria. Mitochondria-localized mRNAs and proteins were obtained from published experiments,. d–f) Empirical cumulative distributions were plotted for all Puf3p targets (top) and the three Puf3p target classes (middle) relative to all mRNAs for the following attributes: enrichment for mRNAs bound by ribosomes at mitochondria (all mRNAs, n = 6,094; Class A, n = 92; Class B, n = 189; Class C, n = 194) (d), as well as change in mRNA abundance (all mRNAs, n = 4,305; Class A, n = 85; Class B, n = 151; Class C, n = 130) (e) and stability (all mRNAs, n = 4,228; Class A, n = 84; Class B, n = 150; Class C, n = 128) (f) in puf3Δ relative to wild-type. The P-values from Kolmogorov-Smirnov (KS) tests comparing the different distributions are indicated (bottom).
Figure 4
Figure 4
RNA Tagging identified transcriptome-wide Bfr1p targets. a) Enrichment of Tagged RNAs detected across different length U-tags in BFR1-PUP yeast relative to a control yeast strain (BY4742). Enrichment was calculated as a ratio of TRPMs obtained in strains with and without the BFR1-PUP chimera. TRPM, Tagged RNAs per million uniquely mapped reads. b) Tagged RNAs detected in the BFR1-PUP strain relative to the control strain (BY4742). Bfr1p target mRNAs (see Online Methods) are colored green while non-targets are grey. c) The number of Tagged RNAs detected for the 1,298 Bfr1p targets in three biological replicates. Spearman’s correlation coefficient (ρ) is indicated (all pair-wise ρ ≥ 0.84, P = 0, n = 1,298). d) Proportional Venn diagram depicting the overlap between Bfr1p targets identified by RNA Tagging versus published RIP-chip targets. e) Selected Go Term enrichments (1/P-value) of Bfr1p targets identified by RNA Tagging and RIP-chip (see Supplementary Data 2 for complete lists).
Figure 5
Figure 5
Bfr1p target classes correlated with membrane functions. a) Heat map of clustered Bfr1p targets, with Classes A (174 targets), B (297), C (566), and D (261) indicated. Each row in the heat map is an individual Bfr1p target, and the colors indicate the number of TRPM detected with U-tags of at least the indicated number of uridines (columns). The highest ranked target is at the top of the heat map, and the lowest ranked target is at the bottom. TRPM, Tagged RNAs per million uniquely mapped reads. (b–e) Enrichments of Bfr1p target classes for mRNAs encoding proteins found in the secretome (b), with predicted transmembrane domains (TMD) (c), localized to the endoplasmic reticulum (ER) (d), and mRNAs found in P-bodies (e). The grey, dotted line represents the enrichment of all mRNAs for the given attribute. (f–h) Empirical cumulative distributions were plotted for the indicated target sets (top) and the four Bfr1p target classes (middle) relative to all mRNAs for the following attributes: enrichment for mRNAs bound by ribosomes generally at the ER (all mRNAs, n = 5,935; Class A, n = 173; Class B, n = 296; Class C, n = 561; Class D, n = 261) (log2(ubc6.7mchx enrichment)) (f), at the SEC complex (all mRNAs, n = 5,974; Class A, n = 174; Class B, n = 297; Class C, n = 560; Class D, n = 261) (log2(sec63.7mchx enrichment)) (g), and at the SSH1 translocon complex (all mRNAs, n = 5,785; Class A, n = 174; Class B, n = 297; Class C, n = 561; Class D, n = 260) (log2(ssh1.heh2.7mchx enrichment)) (h), obtained from published ER-specific ribosome profiling (RP) experiments. The P-values from Kolmogorov-Smirnov (KS) tests comparing the different distributions are indicated (bottom).

Comment in

References

    1. McHugh CA, Russell P, Guttman M. Methods for comprehensive experimental identification of RNA-protein interactions. Genome biology. 2014;15:203. doi: 10.1186/gb4152. - DOI - PMC - PubMed
    1. Tenenbaum SA, Carson CC, Lager PJ, Keene JD. Identifying mRNA subsets in messenger ribonucleoprotein complexes by using cDNA arrays. Proc Natl Acad Sci U S A. 2000;97:14085–14090. doi: 10.1073/pnas.97.26.14085. - DOI - PMC - PubMed
    1. Zhao J, et al. Genome-wide identification of polycomb-associated RNAs by RIP-seq. Mol Cell. 2010;40:939–953. doi: 10.1016/j.molcel.2010.12.011. - DOI - PMC - PubMed
    1. Ule J, et al. CLIP identifies Nova-regulated RNA networks in the brain. Science. 2003;302:1212–1215. doi: 10.1126/science.1090095. - DOI - PubMed
    1. Licatalosi DD, et al. HITS-CLIP yields genome-wide insights into brain alternative RNA processing. Nature. 2008;456:464–469. doi: 10.1038/nature07488. - DOI - PMC - PubMed

Publication types

MeSH terms